PiCK
Bitcoin Nears Capitulation as On-Chain RCV Signal Enters Undervalued Zone Seen at Past Bottoms
Summary
- According to on-chain analysis, Bitcoin’s realized cap variance (RCV) indicator has entered a Deep Value zone that ranks in roughly the bottom 6% of all readings since 2009.
- The analyst said periods when the indicator stayed below a -2.0 z-score — such as early 2015, late 2018 and mid-2022 — preceded 12-month returns of more than 75%.
- Still, the latest signal does not indicate an exact bottom. Current positioning is closer to a capitulation phase, or a period of maximum pain, and may point only to an accumulation window rather than the location of the low.
Forecast Trend Report by Period


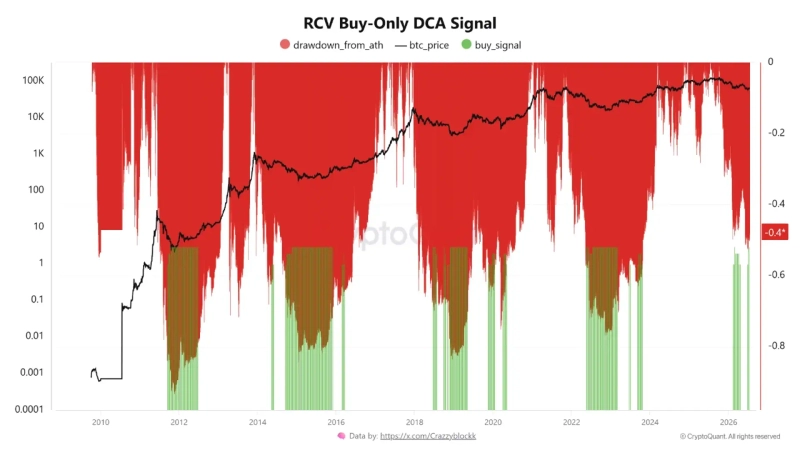
Bitcoin’s on-chain undervaluation signal has dropped to a rarely seen level, approaching readings associated with past market bottoms, according to a CryptoQuant Quicktake analysis. The indicator does not mark an exact bottom, however, and further declines remain possible.
Crazyblock, an analyst active on CryptoQuant Quicktake, wrote on July 15 that Bitcoin’s realized cap variance, or RCV, had entered a range seen less often than one out of every 16 trading days across 16 years of on-chain data.
As of July 15, the standardized RCV reading stood at -2.35. That places it in roughly the bottom 6% of all data since 2009. Bitcoin has stayed in the model’s “Deep Value” zone for 20 consecutive trading days, and the highest-confidence “3x Max Conviction” signal appeared twice, on July 2 and July 9.
RCV is not a price-only indicator. It measures how much the gap between realized capitalization and market capitalization has widened or compressed relative to historical trends. Put simply, it gauges whether the market is overheated or undervalued by comparing investors’ average cost basis with current market value.
When that variance compresses into a deeply negative z-score range, much of the emotional premium built up during a bull market has already been priced out, according to Crazyblock. The indicator reads capital distribution rather than market narratives.
Bitcoin was trading near $64,700, about 48% below its record high of $124,700 reached in October last year.
Crazyblock said similar periods have appeared before. Extended stretches when the model remained below a -2.0 z-score — including early 2015, late 2018 and mid-2022 — all preceded 12-month returns of more than 75%.
In November 2018, RCV fell to -4.68, the most extreme reading in the data. That almost coincided with Bitcoin forming its cycle bottom at about $3,792.
Still, the analyst stopped short of calling the latest signal an immediate bottom. “I am not declaring a bottom,” Crazyblock wrote. “This model does not claim to identify the exact low, and as in 2018, the indicator can compress further before a reversal.”
Current positioning is statistically much closer to capitulation than to a mid-cycle correction, he wrote. Among 229 signals since 2011, instances in which maximum-conviction signals appeared in quick succession generally pointed to a period of maximum pain rather than ordinary correction noise.
The framework indicates when accumulation may be taking place, Crazyblock added. It does not show where the bottom is.

Minseung Kang
minriver@bloomingbit.ioBlockchain journalist | Writer of Trade Now & Altcoin Now, must-read content for investors.