War, AI and Dollar Distrust Ignite Rare ‘Everything Rally’ in Commodities
Summary
- The global commodity price index, the FTSE/CRB Commodity Index, has surged to its highest level since the 2008 global financial crisis.
- This super rally is being driven by a mix of factors, including the Middle East war, an AI-driven copper spike, and gold hoarding fueled by distrust in the dollar.
- Like past episodes, the commodity rally has emerged as a key variable for the global economy because it could lead to inflation, interest-rate increases, and economic recession.
Forecast Trend Report by Period


Oil, Copper Spur Biggest Commodities Rally in 18 Years
Commodity Price Index Jumps to Highest Since Global Financial Crisis
Middle East War, AI-Driven Copper Spike, Gold Hoarding on Dollar Distrust
From Grocery Bills to Interest Rates, Commodities Re-Emerge as an Economic Shock
Global commodity markets have entered what would be the sixth “super rally” since World War II, with prices for oil, metals and grains climbing to their highest levels in 18 years.
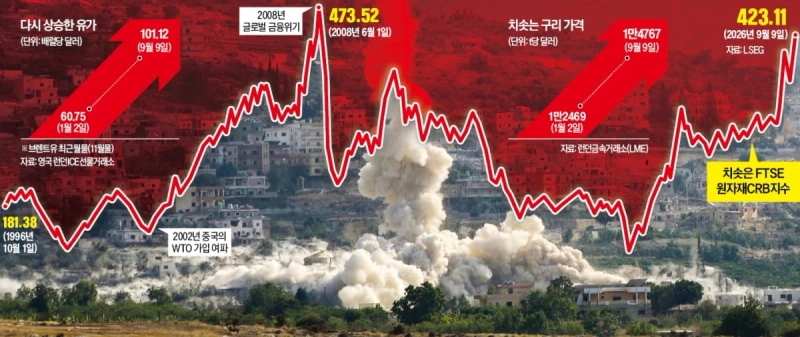
The FTSE/CRB Commodity Index, a broad gauge of raw-material prices, rose to 423.11 on Sept. 9, according to London Stock Exchange Group data. That was up 42.0% from 297.82 at the start of the year and marked the highest level since the 2008 global financial crisis.
Since the index was created in 1957, there have been six major rallies in which it climbed more than 30% within a year. Those episodes included the former Soviet Union’s large-scale grain purchases in 1972 and the Iranian Revolution in 1979. In 2002, a global demand boom after China joined the World Trade Organization helped drive another rally.
This rally is structurally different. Multiple forces are at work, from Middle East tensions and US tariff policy to artificial-intelligence data centers. After the US attacked Iran on Feb. 28, the Strait of Hormuz was effectively shut. As attacks between the US and Iran resumed recently, Brent crude futures climbed back above $100 a barrel. Rising global investment in AI is also fueling the move. Copper, used in data centers, power grids and electric vehicles, hit a record $14,767.5 a ton on the London Metal Exchange on Sept. 9 as demand increased. Aluminum and other materials also surged as buyers moved to front-load purchases ahead of US tariffs.
The rally is reshaping the global inflation outlook. The International Monetary Fund raised its forecast for worldwide inflation this year to 4.7% in July from 4.4% in April.
Japan’s Nikkei warned that rising commodity prices are complicating monetary policy in major economies and weighing more heavily on Asian countries such as Japan that rely on imported resources.
A Sixth Rally Since World War II — and Why This Time Is Different
Stabilizing Prices Will Require a More Complex Fix, From Ending the War to More Oil and Mine Investment
Global commodity markets have once again emerged as a key variable for the world economy. The FTSE/CRB Commodity Index, which tracks broad moves in international prices for oil, metals and grains, is approaching its all-time high of 474 set in 2008. Unlike past rallies, this one is being driven by a mix of forces. That means bringing prices back under control will require a far more complicated solution.
A More Complex Set of Drivers
The CRB Index was first calculated in 1957 by the US Commodity Research Bureau using 28 commodity products. The current index is made up of 22 items: 39% energy, 41% agricultural products, 13% industrial metals and 7% precious metals. Crude oil alone accounts for 23%. That helps explain why most commodity rallies in history were built on oil.
This time is different. As of Sept. 9, Brent crude futures were trading at about $101 a barrel. That was below the level seen immediately after the Strait of Hormuz was shut, when prices topped $120 a barrel. But copper, aluminum, gold, silver and natural gas have all risen together, pushing the index higher. Copper futures are up more than 47% over the past year. Gold and silver have climbed more than 20% and 50%, respectively, from a year earlier. European natural gas prices, based on the TTF benchmark, recently approached $23 per million Btu, nearly double the level before the US-Iran war.
Earlier commodity rallies were usually driven by one or two central factors. The first began in 1972, when the Soviet Union’s large grain purchases sent grain prices sharply higher. The advance spread to energy the following year, after Arab oil producers imposed an oil embargo and cut output during the Yom Kippur War. In the second rally, in 1979, the Iranian Revolution caused oil prices to double, while gold and silver also surged.
Most Rallies Ended in Recession
During the third rally, in 2008, the CRB Index reached a record high. Oil surged above $140 a barrel. A major driver was the so-called emerging-market supercycle that followed China’s accession to the WTO in 2002. The fourth rally was driven by global quantitative easing in 2009, China’s massive stimulus and the Arab Spring in 2011. The CRB Index rose back to 370 in April 2011. In the fifth rally, a surge in global demand after the spread of Covid-19 coincided with Russia’s invasion of Ukraine, pushing the CRB Index back above 300 in June 2022. In each case, surging commodity prices fed inflation and governments and central banks reacted only later. As steep rate increases weakened demand, commodity prices fell.
This time, the Iran war shut the Strait of Hormuz and sent oil prices higher, lifting the CRB Index from 323 in January to above 400 in May. Wider use of AI and electrification tied to decarbonization sharply increased demand for copper used in data centers and electric vehicles. Gold and silver rose as the dollar’s value wavered. Demand for alternatives to dollar assets increased, fueling heavy gold buying centered on China.
What Could Stabilize Commodity Prices
Oil remains the biggest variable. The US Energy Information Administration recently projected that Middle East production and trade would return to prewar average levels in the second quarter of next year as rerouted shipments and export recovery take hold. Under that scenario, average Brent spot prices would fall to $67 a barrel in the second half of next year.
Goldman Sachs, by contrast, projected Brent would top $120 a barrel if Middle East tensions persist into next year and regional oil production remains 4 million barrels a day below prewar levels.
Copper will be driven more by AI and electrification than by war. Data centers use large amounts of copper not just in servers, but also in substations, distribution grids, cooling equipment and backup power systems.
New mines take years to develop, meaning supply responds slowly even when prices rise. Gold will track the dollar and monetary policy across major economies.
Gold is benefiting from safe-haven demand tied to a weaker dollar. But if inflation pushes up long-term government bond yields, gains in the non-yielding metal may be limited.
Kim Joo-wan/Oh Se-sung, Hankyung.com reporters kjwan@hankyung.com

Korea Economic Daily
hankyung@bloomingbit.ioThe Korea Economic Daily Global is a digital media where latest news on Korean companies, industries, and financial markets.