"Ethereum Shows Chart Similarities to Dow Jones Index…Possible to Reach $8,000"
Summary
- It was analyzed that Ethereum's chart movements are similar to those of the past Dow Jones Index.
- It was stated that if the $3,900~$4,150 resistance zone is broken, Ethereum could reach $8,000 by early next year.
- Based on the expanding triangle pattern and Elliott Wave Theory, there is an analysis that Ethereum is in the final surge phase.
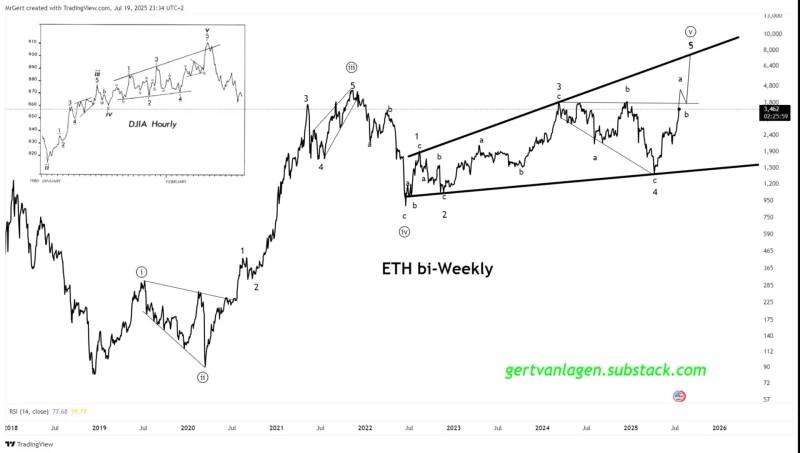
There is an analysis that Ethereum (ETH) shows chart movements similar to the past Dow Jones Index, and could surge up to $8,000.
According to Cointelegraph on the 21st (local time), cryptocurrency analyst Gert van Lagen stated, "Currently, Ethereum is showing a pattern very similar to the Dow Jones Index in 1980," and explained, "If the $3,900~$4,150 resistance zone is broken, it could reach $8,000 by early next year."
The analyst particularly focused on the expanding triangle (megaphone) pattern. He explained, "Previously, the Dow Jones Index formed an expanding triangle pattern on the hourly chart before reaching its peak," and added, "Currently, the Ethereum chart also has an expanding triangle pattern, and the support from the lower trend line has also been confirmed." Furthermore, he stated, "According to Elliott Wave Theory, Ethereum is currently in the final blow-off top phase," describing it as "the most volatile period, when the last buyers enter."

Son Min
sonmin@bloomingbit.ioHello I’m Son Min, a journalist at BloomingBit