Crypto market jolted by Trump remarks…Bitcoin and Ethereum fall together [Lee Soo-hyun’s Coin Radar]
Summary
- Bitcoin said weakness below $90,000 is persisting as geopolitical risk and policy uncertainty overlap, driven by President Trump’s Greenland tariffs remark and the possibility of a delay in deliberations on the 'CLARITY Act.'
- Ethereum remains weak below $3,000 amid spot ETF net outflows, large-scale long-position liquidations, and concerns about a break of the $2,800–$3,000 support. However, declining exchange balances were cited as a medium- to long-term positive factor.
- XRP (XRP) and Solana (SOL) have each fallen below $2 and $130, respectively, with additional downside risk raised on factors including accumulating realized losses, rising open-interest volatility, and a breakdown from an ascending wedge pattern. Analysts said reclaiming $2 is key for XRP, while Solana’s key is reclaiming the $136 support.
Forecast Trend Report by Period


<Lee Soo-hyun’s Coin Radar> is a weekly column that tracks moves in the virtual asset (cryptocurrency) market and explains what’s behind them. Going beyond a simple listing of prices, it provides a multidimensional analysis of global economic issues and investor positioning, offering insights to help gauge the market’s direction.
Major coins
1. Bitcoin (BTC)

Bitcoin fell nearly 7% over the past week on CoinMarketCap, slipping below $90,000. As of the 23rd, it is still hovering around $89,000 on CoinMarketCap.
The decline is seen as driven less by a routine technical pullback than by geopolitically fueled risk sparked by remarks from President Trump, which weighed on risk assets broadly.
The most direct trigger cited was President Trump’s “Greenland tariffs” remark. Trump said he could raise tariffs by as much as 25% on eight NATO member states that opposed the purchase of Greenland and sent troops, until a deal is reached.
After the comment, tensions between the U.S. and Europe resurfaced, amplifying risk-off sentiment. With renewed focus on strains over rare earths and strategic resource supply chains with Europe, global markets saw risk appetite fade, and Bitcoin was unable to avoid downside pressure.
Later, on the 21st (local time), President Trump attended the Davos Forum in Switzerland and said shortly after his participation that he had decided not to impose tariffs on the eight European countries that opposed Greenland’s annexation. This prompted a short-term bounce, but demand was not strong enough to change the trend.
At the same event, Trump also said he hopes to quickly sign the CLARITY Act, a U.S. crypto market-structure bill, but its impact on prices was limited.
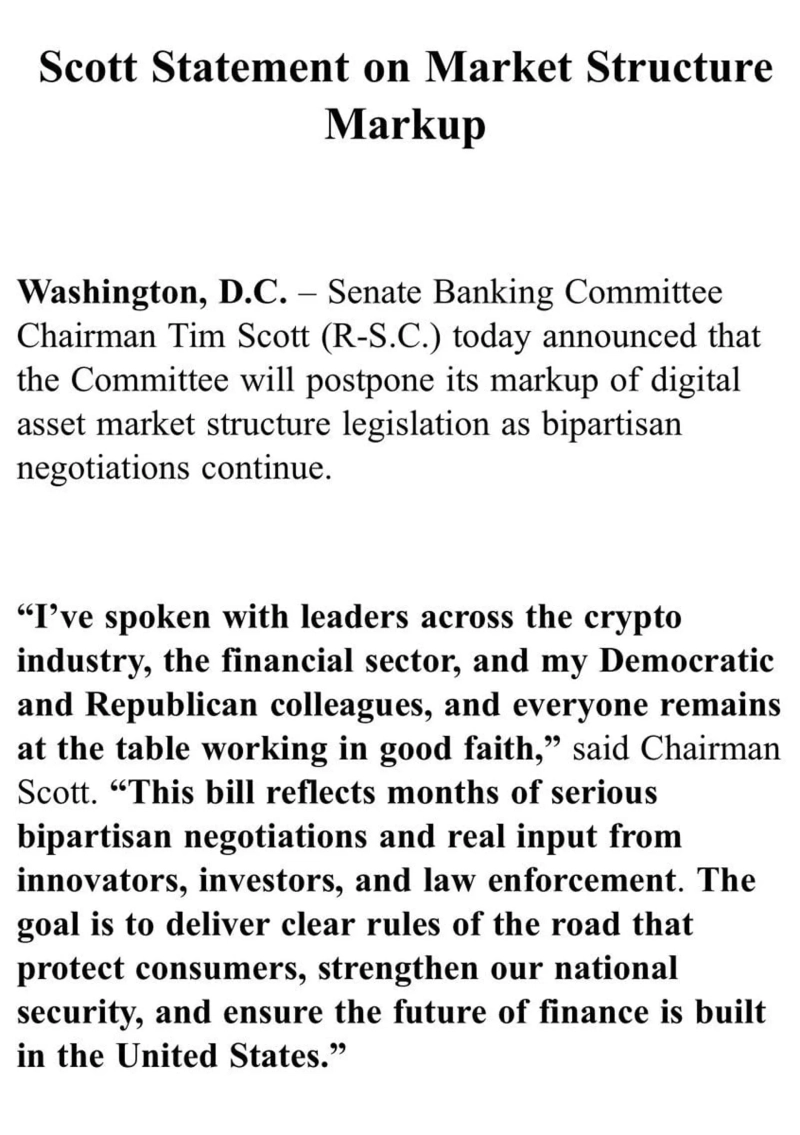
Policy uncertainty also returned as a headwind. On the 22nd, Bloomberg, citing sources, reported that the U.S. Senate Banking Committee is likely to push back consideration of the CLARITY Act to late next month or March. The Trump administration’s prioritization of housing policy ahead of the November midterm elections was cited as the backdrop. Although the Senate Agriculture Committee released a draft amendment and flagged a markup for the 27th, the delay in the Banking Committee’s schedule has led to assessments that expectations for regulatory clarity have been pushed back again.
Some also argue that the dispute with Europe is not fully over. On the 22nd, in a Fox Business interview, President Trump said, “If Europe sells U.S. Treasuries or other U.S. assets, I will take strong retaliatory measures.” Earlier, Danish pension fund AkademikerPension decided to dispose of its U.S. Treasury holdings in protest of the U.S. plan to annex Greenland, and Greenland pension fund SISA is also reportedly reviewing whether to halt U.S. equity investment—remarks interpreted as targeting those moves.
Looking to next week, the selection of the next Fed chair is seen as the biggest variable. Trump said at Davos that he would announce the new Fed chair soon, and Treasury Secretary Scott Bessent also said a nomination could come next week. On the 28th, the U.S. Securities and Exchange Commission (SEC) and the Commodity Futures Trading Commission (CFTC) are set to hold a joint event on aligning regulatory jurisdiction over virtual assets, and what messages the two agencies deliver could also be a near-term volatility factor.
Price outlook remains skewed cautious. Crypto outlet Cointelegraph suggested that if the $86,500 support breaks, there is room for an additional drop to $84,000. Conversely, if Bitcoin can decisively clear resistance around $91,700, it could attempt a recovery toward $94,000 and $97,000.
On-chain analytics firm Glassnode said, “Bitcoin is holding in a range between $81,100 and $98,400, and repeated selling pressure is emerging around $98,400, the average cost basis for short-term holders.” It added, “Unless demand momentum clearly recovers, breaking above $100,000 will not be easy,” offering a more conservative view.
2. Ethereum (ETH)

Ethereum also failed to avoid weakness this week. It fell more than 10% over the past week on CoinMarketCap, dropping below the $3,000 level. As of the 23rd, it is still trading around $2,900 on CoinMarketCap.
While renewed concerns over U.S. tariff pressure on Europe and trade frictions widened the decline, institutional flows were also cited as a factor that intensified downside pressure. Since trading began this week, Ethereum spot ETFs have seen persistent net outflows, with more than $510 million exiting over just two days on the 20th–21st. As prices slid, institutional money also pulled back, reinforcing the bearish trend.
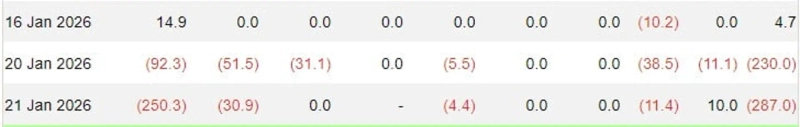
Liquidations of long positions in derivatives markets also amplified the drawdown. On the 20th, when the decline gathered pace, roughly $392 million worth of liquidations occurred in Ethereum, with more than 95% reportedly coming from long positions. As leveraged bets built on expectations of a rise were unwound all at once, a classic structure emerged in which prices fall faster.
Of course, over the past 24 hours there was a rebound that briefly reclaimed $3,000, but many say it is too early to conclude that demand indicators have clearly revived. Caprioli Investment’s “apparent demand” indicator plunged from about 92,000 ETH in mid-December last year to -3,562 ETH in mid-month. Given past cases where similar demand slowdowns preceded sharp drops, observers caution that a short-term bounce without a recovery in demand should be treated warily.
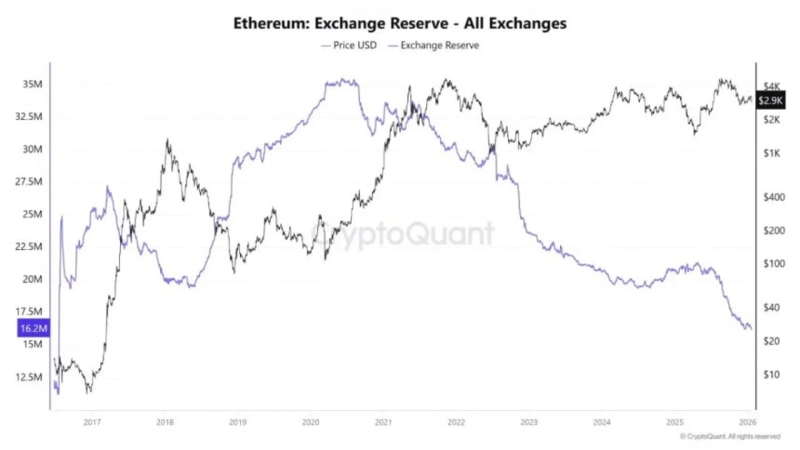
Still, over the medium to long term, declining exchange balances are being cited as a positive factor. According to CryptoQuant, the amount of Ethereum held on exchanges fell to around 16.2 million as of the 21st, the lowest level since 2016. Binance’s Ethereum holdings were also noted to have declined from 4.168 million at the start of the year to around 4.0 million. Historically, when exchange balances fall, immediately sellable supply declines, which in many cases has been supportive for prices over the medium to long term.
Technically, the $2,800–$3,000 zone is viewed as a key defensive line. Cointelegraph said the area is where roughly 9 million ETH has been accumulated over the past six months, and assessed it as a price band where medium- to long-term demand has formed. However, it also warned that if support breaks, prices could test $2,460, where the 200-day moving average sits, and even $2,000, a psychological support level.
3. XRP (XRP)
XRP fell nearly 8% over the week, struggling to rebound during the market’s correction and giving up the $2 level again. As of the 23rd, it is trading around $1.9 on CoinMarketCap.
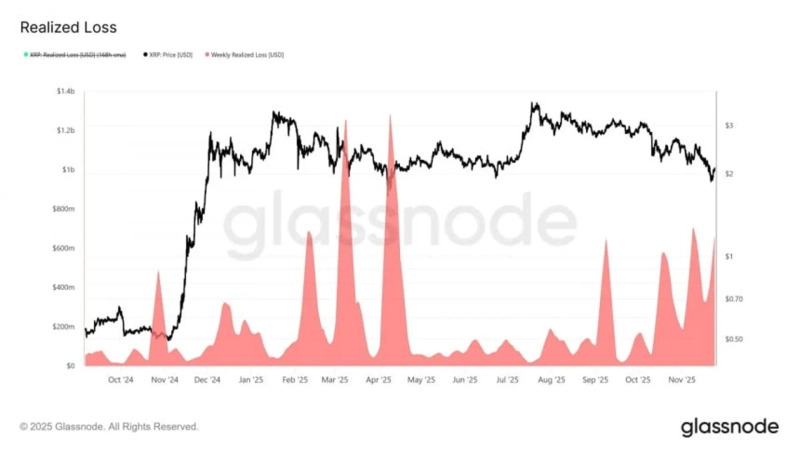
With repeated supply overhang building near $2, the correction has led to interpretations that the area is hardening as resistance rather than support. According to Glassnode, the recent XRP market shows a structure in which the profit-and-loss gap between short-term and mid- to long-term holders has widened sharply. New buyers who entered within one week to one month are in profit after buying at relatively lower levels, while many investors holding for six to 12 months or longer remain in the red.
In such a structure, even a modest price rise can prompt short-term holders to take profits, while mid- to long-term holders may view it as an “exit opportunity” and sell. Glassnode data show that in each weekly retest zone around $2 since mid-2025, realized losses of roughly $500 million to $1.2 billion repeatedly occurred. This indicates that the price area is acting not as a new accumulation zone, but as an exit ramp for existing holders.
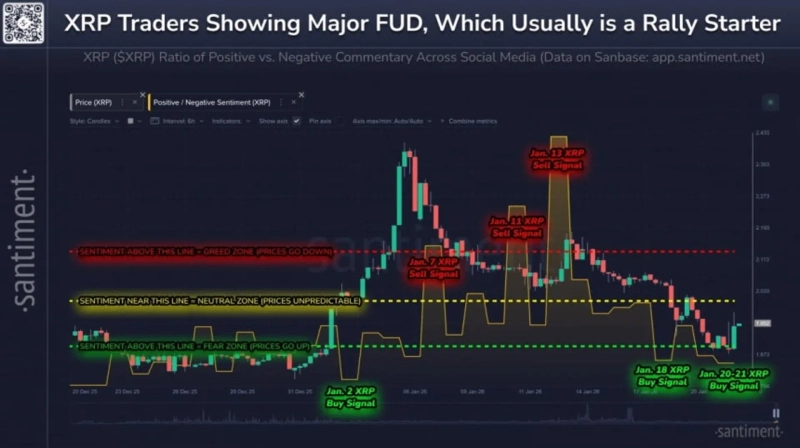
Sentiment indicators also look subdued. According to Santiment, XRP has fallen about 19% from its January 5 peak, pushing investor sentiment into the “extreme fear” stage. Typically, rising fear is interpreted as a sign that retail investors are exiting in large numbers or shifting to a wait-and-see stance.
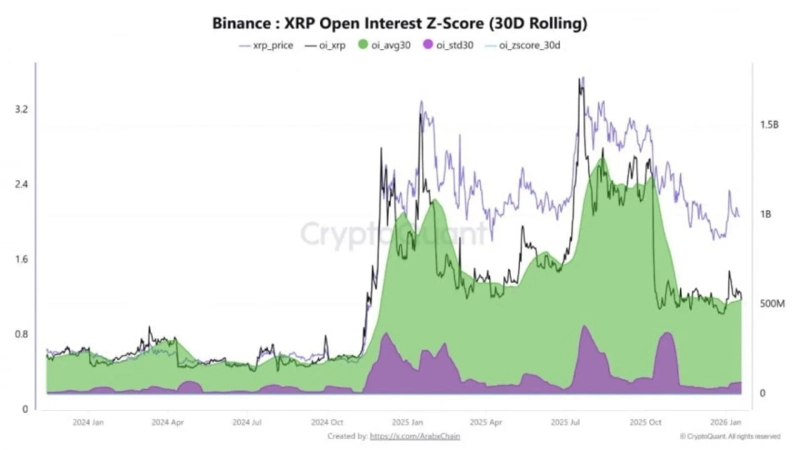
In XRP derivatives markets this week, signals of directional probing are being observed. On the 20th, Binance’s XRP open interest rose above its 30-day moving average, confirming inflows. Total open interest stood at about $566.48 million, exceeding the 30-day average of $528.84 million. CryptoQuant contributor Arab Chain analyzed, “This is a signal of new inflows, but it does not resemble the past pattern of speculative leverage sharply crowding in. It is better interpreted as gradual positioning to probe direction rather than aggressive betting.”
Still, there are points to watch. The 30-day standard deviation of open interest jumped to about $65.7 million, the highest level since last November. Such volatility expansion is typically interpreted as a sign that large price moves may be approaching. While it is not yet an overheating phase, the possibility of an imminent decisive directional breakout should be kept in mind.
In terms of price levels, regaining $2 is seen as the most urgent task. If XRP reclaims $2, a rebound toward $2.06 and $2.10, and even $2.20–$2.25, is being discussed. If it fails to recover, support at $1.92 and then $1.90 could be tested in order, and a break could open the way to $1.85 or lower.
Issue coins
1. Solana (SOL)

Solana (SOL) fell nearly 10% over the past week on CoinMarketCap, giving up the $130 level. As of the 23rd, it is still hovering around $128 on CoinMarketCap.
With on-chain indicators and technical trends deteriorating simultaneously, the short-term bearish tone appears to have intensified. According to Glassnode, Solana’s Net Realized Profit/Loss metric posted net losses for four consecutive trading days. This suggests that selling that accepts losses, rather than profit-taking, is increasing. In such phases, underwater holders can accumulate, and even if a rebound occurs, “breakeven supply” can build, increasing short-term selling pressure.
Technical signals were also cited as a burden. Crypto outlet BeInCrypto analyzed that “Solana broke down from an ascending wedge pattern, turning the trend lower,” while another crypto outlet NewsBTC noted that “after failing to hold above $140, support at $136 and then $135 gave way in succession, reinforcing an additional downside move.” The assessment is that the structure may allow for another shakeout before any rebound in the short term.
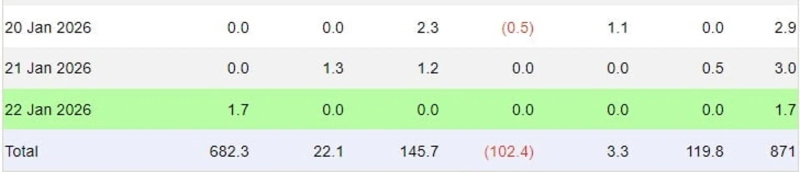
However, some argue it is hard to view flows as a full exit. That is because inflows into Solana spot exchange-traded funds (ETFs) have remained resilient even during the correction. Solana spot ETFs recorded net inflows of $7.69 million for three consecutive sessions from the 20th to the 22nd. Cumulative net inflows to date stand at $871 million.
Even so, the outlook is not very bright. BeInCrypto projected that “to invalidate the short-term bearish scenario, it needs to reclaim support at $136,” adding that “there is currently a possibility of retesting $128.” NewsBTC presented $129 and $125 as key supports, warning that “if $125 breaks, $120 and even as low as $112 could open up.” Overall, the prevailing view is that to call it a trend reversal, the market needs to retake upper levels, including a break above $136–$138 and a recovery of $144.
Lee Soo-hyun, Bloomingbit reporter shlee@bloomingbit.io

Suehyeon Lee
shlee@bloomingbit.ioI'm reporter Suehyeon Lee, your Web3 Moderator.