Solana’s on-chain metrics remain resilient despite a 72% correction…ETF outflows also limited
Summary
- Solana is down 72% from its all-time high, but on-chain activity and ETF flows are described as relatively stable.
- Solana spot ETFs have seen inflows slow versus the initial period, but cumulative net outflows during the recent four-month selloff were limited to about $11.3 million.
- The market is said to be viewing the current price as a “valuation gap,” citing firm network metrics along with the $51–$80 support and $120 resistance zones.
Forecast Trend Report by Period


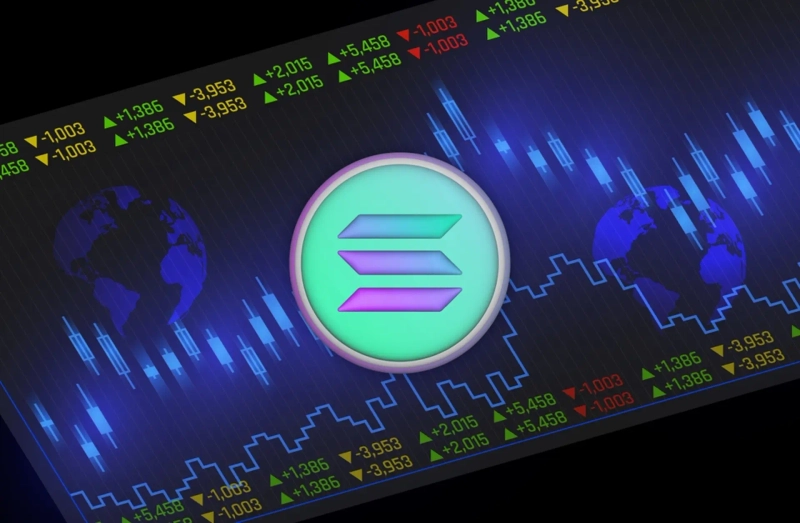
Solana (SOL) has extended its bearish trend, down 72% from its all-time high, but on-chain activity and exchange-traded fund (ETF) flows appear to be holding relatively steady.
According to Cointelegraph on the 27th (local time), Solana was trading around $82, well below the roughly $188 level seen at the launch of spot ETFs in October 2025. Still, even as the price plunged over the four months since December 2025, cumulative net ETF outflows totaled only about $11.3 million over two weeks.
That contrasts with spot Bitcoin (BTC) and Ethereum (ETH) ETFs, which posted net outflows for four consecutive months over the same period. Solana spot ETFs, which had averaged more than $100 million in net inflows per week during the first five weeks after launch, have recently seen inflows slow to about $20 million–$25 million per week.
Network metrics also remain solid. Over the past 30 days, Solana’s decentralized exchange (DEX) trading volume reached $108 billion, exceeding Ethereum ($63.7 billion) and Base ($31.4 billion). On a 24-hour basis, app revenue came in at $3.1 million, slightly above Ethereum ($2.95 million), while active addresses (2.17 million) and chain fees also outpaced rival chains. The real-world asset tokenization (RWA) segment rose 45% over 30 days to a record $1.71 billion.
On the technical front, the $60–$70 range (0.75 Fibonacci retracement) and a weekly demand gap (FVG) in the $22–$29 range are cited as medium- to long-term support zones. The setup currently reflects an attempt to rebound after a retest of the $51–$80 demand zone, but the market has yet to break above the weekly resistance at $120. The UTXO Realized Price Distribution (URPD) shows more than 6% of supply concentrated around the current price zone, forming a dense pocket of cost-basis support.
Market participants describe the price compression—while network activity and ETF positioning have not seen a sharp exodus—as a “valuation gap.” Cointelegraph pointed to “whether the $51–$80 support zone holds and whether resistance at $120 is cleared” as the key variables that will determine the medium-term direction.

Suehyeon Lee
shlee@bloomingbit.ioI'm reporter Suehyeon Lee, your Web3 Moderator.