PiCK
Bitcoin retreats to the $65,000 level… Middle East tensions and quantum risks deliver a ‘double shock’ [Lee Soo-hyun’s Coin Radar]
Summary
- Bitcoin faced a ‘double shock’ as Middle East geopolitical risk and quantum-computing security concerns overlapped, with the $65,000 area cited as a key near-term support level.
- Ethereum showed a 30-day average return and Sharpe ratio below 0, indicating a weak risk-return profile, with $2,108 and $2,388 identified as key price zones.
- XRP and Solana were said to have seen structural pressures intensify due to low liquidity and volume and, respectively, a major hack and institutional outflows.
Forecast Trend Report by Period


<Lee Soo-hyun’s Coin Radar> is a weekly column that tracks the flow of the digital-asset market and provides in-depth explanation of the backdrop. Going beyond a simple listing of prices, it offers a multi-dimensional analysis of global macro issues and investor behavior, delivering insights to help gauge market direction.
Major coins
1. Bitcoin (BTC)
Bitcoin extended its losses this week, at one point sliding to the $65,000 level. As of the 3rd, it has rebounded slightly and is trading around $66,000 on CoinMarketCap.
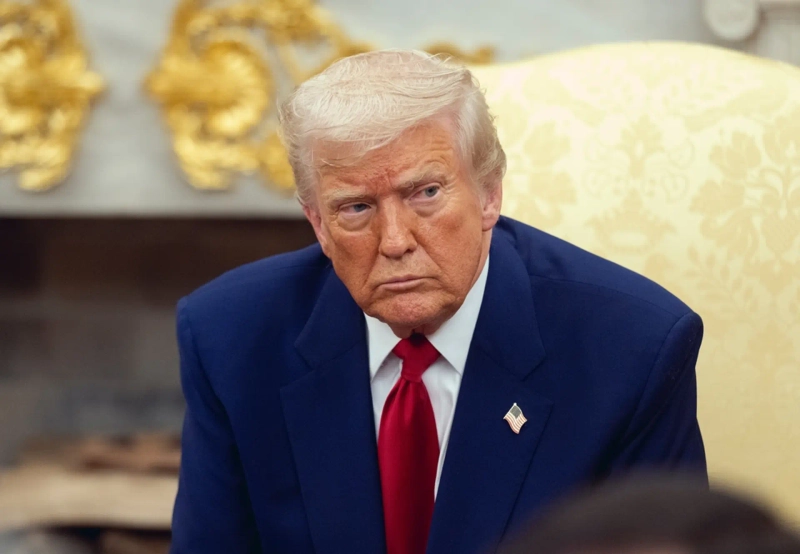
The key variable was, as expected, geopolitical risk emanating from the Middle East. The market initially focused on the possibility that U.S. President Donald Trump’s address to the nation might include a message about an end to the war or a ceasefire. Contrary to expectations, however, a hardline military message emerged, jolting markets.
On the 1st (local time), President Trump said he would “hit Iran very hard within the next 2–3 weeks,” sharply ratcheting up military tensions, and even used the highly forceful phrase that he would “send it back to the Stone Age,” amplifying risk.
Of course, while emphasizing the results of the ongoing military operation, Trump left some room for negotiations. Still, the market appears to be placing more weight on a military scenario than on diplomacy. Iran, too, has reiterated the possibility of blocking the Strait of Hormuz and maintained a hardline response posture, further intensifying tensions.
In particular, as signs emerged that the United Arab Emirates (UAE) is considering joining a military coalition—suggesting tensions spreading across the broader Middle East—the market quickly priced in the chain of “energy supply shock → renewed inflation pressure → higher rate burden.” In that structure, Bitcoin continued to face selling pressure as a risk asset rather than a safe haven.

Technical risk also weighed on sentiment. Google recently published research related to quantum computers, raising potential concerns about Bitcoin’s security architecture. According to the research, decryption may be possible with around 500,000 qubits—fewer than previously expected—and a scenario was presented in which, in theory, private keys could be calculated within about nine minutes before a block is created, enabling asset theft.
An analysis suggesting that roughly one-third of Bitcoin’s supply—about 6.9 million BTC—could be exposed to potential risk in this way also dampened market sentiment. However, this is seen less as a short-term risk and more as a factor pointing to possible structural change over the medium to long term. Google sees commercialization of quantum computing around 2029, underscoring the need to build countermeasures.
On the price front, the area around $65,000 is cited as a key near-term support level. Ayushi Jindal, a researcher at NewsBTC, said that “most of the gains were given back after failing to break through resistance at $68,800,” adding that “below $68,000, additional downside pressure could persist.” In particular, if the $66,000–$65,500 zone breaks, analysis suggests the door opens to a decline toward $64,200.
Over the medium term, whether the $60,000 level holds is important. DailyForex’s Christopher Lewis said that “some support is being maintained even amid geopolitical risk, but if $60,000 breaks, selling pressure could expand significantly.” Digital-asset outlet Cointelegraph also suggested that if it drops below $65,000, further downside to $62,500 and $60,000 is possible.
2. Ethereum (ETH)
Ethereum held the $2,000 level and appeared stable on the surface, but internally it looks weak. As of the 3rd, it is holding around $2,050 on CoinMarketCap.
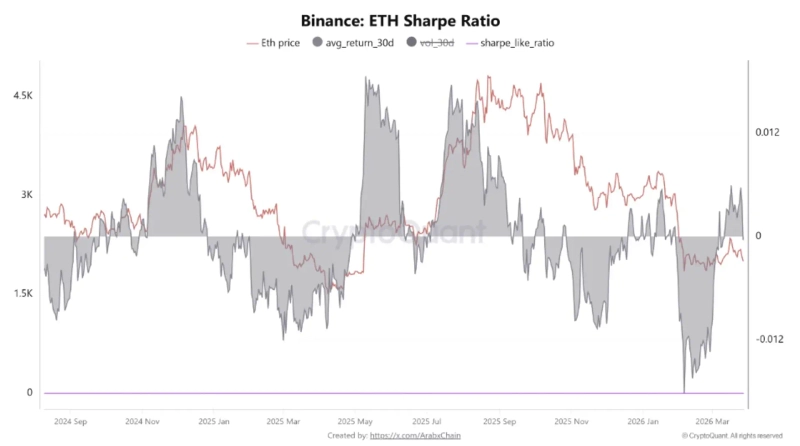
As a result, while price is being maintained, analysis suggests profitability and market efficiency have deteriorated. According to ArabChain, a CryptoQuant contributor, Ethereum’s 30-day average return on Binance was -0.00039, and the Sharpe ratio came in at around -0.0012. The Sharpe ratio measures risk-adjusted return efficiency; a reading below 0 implies low investment efficiency. In other words, Ethereum is in a structure that is not providing sufficient returns relative to risk. ArabChain assessed that “even if the price appears stable, this can be interpreted as meaning the qualitative aspects of the market have not yet recovered.”
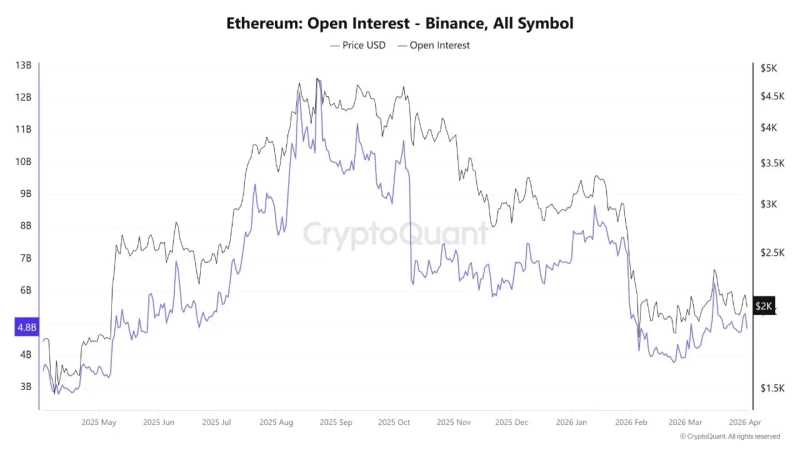
A similar pattern is visible in the futures market. According to FelinaiPA, another CryptoQuant contributor, Ethereum’s open interest fell sharply during the decline. This indicates that leveraged positions were liquidated en masse, reducing aggressive bets. Some interpret this as an improvement in market structure, but the issue is what comes after. The key point is that open interest has not been rising alongside price even as it attempts to rebound. FelinaiPA said, “This means inflows of new money are limited and participants still lack conviction about direction,” adding that “for a strong uptrend to form, price and open interest need to rise together.”
In terms of levels, $2,388 is presented as a key resistance. Investment outlet FXStreet said that if that area is cleared, upside room could open toward $2,746 and $3,412. Conversely, if $2,108 breaks, downside opens sequentially to $1,911 and $1,741, with further room toward $1,524 and $1,405 as well.
Meanwhile, Markus Thielen, a researcher at 10X Research, said Ethereum has recently formed a bear-flag pattern. Given cases in the past where similar patterns were followed by sharp declines, he said it is necessary to be mindful of additional short-term downside risk. However, if it re-establishes itself above $2,050, that could be interpreted as a signal of market stabilization.
3. XRP (XRP)
XRP also saw weak price action this week amid the broader market downturn. As of the 3rd, it is trading around $1.3 on CoinMarketCap.
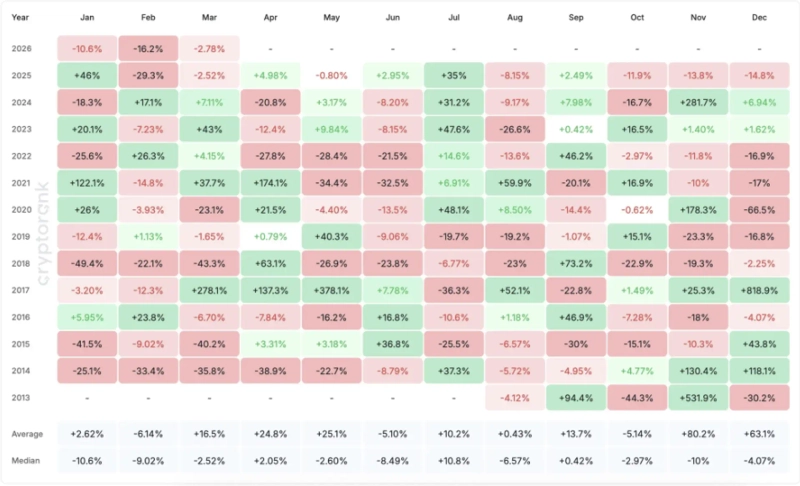
In particular, despite expectations for seasonal strength in April, actual market data still shows a bearish tone. According to U.Today, historically the average April gain is about 24%, but the median is only around 2%, suggesting that a few outsized rallies pulled the average higher.
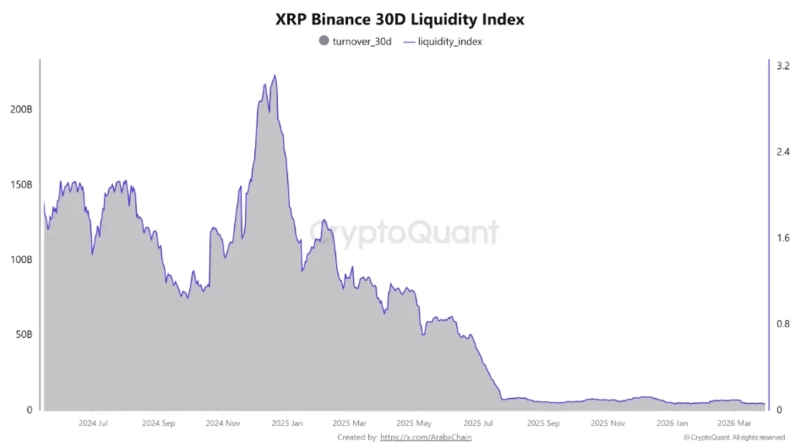
Accordingly, rather than simple seasonality, the actual market environment is likely to matter more. Current on-chain indicators instead call for caution. According to ArabChain, XRP’s 30-day liquidity index fell to about 0.062, one of the lowest levels recently. This indicates the market has become less deep, creating an environment in which price volatility can widen even on modest trading. At the same time, 30-day trading volume also decreased to about $4.46 billion, showing participation has contracted.
This flow suggests price may stagnate or remain weak amid a lack of inflows. Some interpret this as an accumulation zone, but for now, the view that contraction signals are more pronounced than recovery signals is prevailing.
There is also a technical overhang. According to Binance data, XRP is currently below its 30-day moving average (MA30) of about $1.40, its 90-day moving average (MA90) of $1.64, and its 200-day moving average (MA200) of $2.06. It is assessed that bearish momentum persists across the short, medium, and long term.
In the near term, whether it can reclaim $1.40 is key. ArabChain said that recovering that area could be interpreted as a signal of improved momentum. However, market analyst EGRAG Crypto also said, “If it fails to regain $2 on a monthly closing basis, a full-fledged shift to an uptrend will be limited.”
Ultimately, XRP is in a zone where there is a gap between expectations and actual data, and whether liquidity and volume recover is cited as the key variable that will determine direction going forward.
Issue coins
1. Solana (SOL)
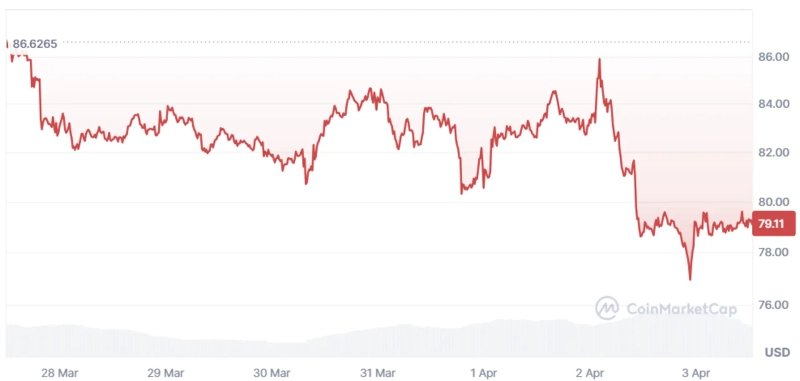
Solana has recently seen its decline deepen, weighing on investor sentiment. Over the past week, it fell more than 9% on CoinMarketCap, posting a notable drop among top altcoins. As of the 3rd, it is trading around $79.
The biggest negative factor driving the slide is a hacking issue at a core DeFi project in the ecosystem. Solana-based decentralized exchange (DEX) Drift Protocol was reported to have suffered a hacking attack worth about $285 million. More than half of its total value locked (TVL) of about $550 million is said to have been drained. By size, it would be the second-largest in Solana’s history after the 2022 Wormhole hack.
The problem is that this incident may not end as a simple, isolated project risk. The market believes that when a major hack occurs, it can spread into broader doubts about the chain’s overall security framework and audit standards. Accordingly, analysis suggests it could weigh on trust across the Solana-based DeFi ecosystem.
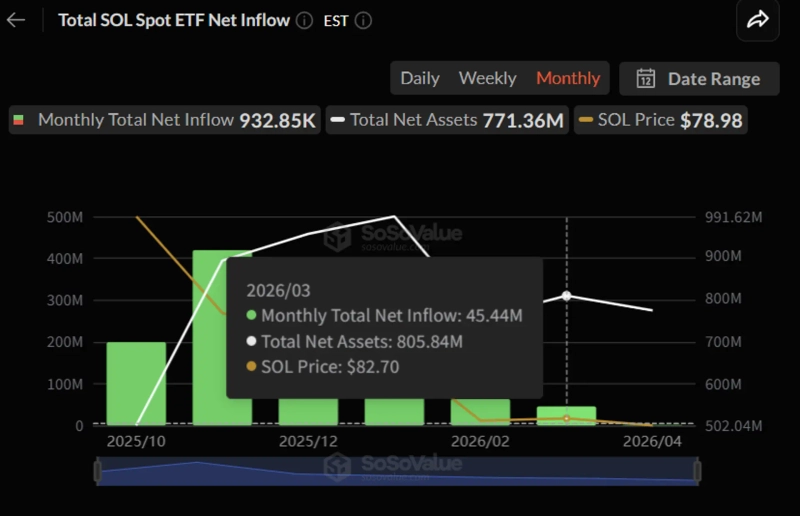
Additional burdens have also piled on. Institutional outflows and delays in technical updates are appearing at the same time. According to SosoValue data, over the past five months, spot Solana ETF flows reportedly plunged from about $419 million to $45 million. This suggests institutional demand is cooling rapidly.
Another variable is the delay in the core upgrade schedule. The ‘Alpenglow’ upgrade being pursued by the Solana Foundation had drawn expectations for improved network throughput, but the timeline was pushed back from Q1 2026 to Q2. The market sees the deferral of the anticipated positive catalyst as having a negative impact on short-term sentiment. So far, additional roadmap updates have also been limited.
Ultimately, in the short term, whether trust is restored and, over the medium to long term, whether technical updates and institutional inflows recover are likely to act as the key variables determining Solana’s price direction.

Suehyeon Lee
shlee@bloomingbit.ioI'm reporter Suehyeon Lee, your Web3 Moderator.