PiCK
Bitcoin Defends $75,000 as Mideast Risks, Fed Uncertainty Cap Gains Near $80,000
Summary
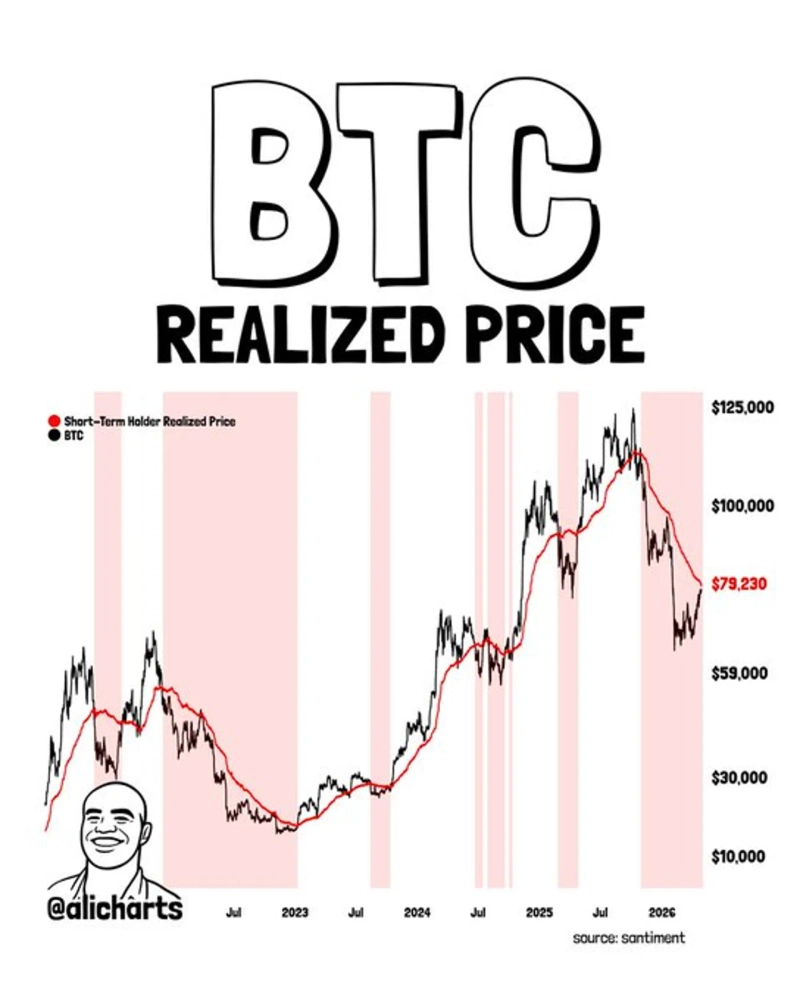
- Geopolitical tensions in the Middle East and uncertainty over Fed policy are putting downside pressure on Bitcoin as it trades between support at $75,000 and resistance at $80,000.
- Spot Bitcoin ETFs have recently shifted to net outflows, while capital has rotated from DeFi back into Bitcoin as Bitcoin dominance rises above 60%, weakening short-term flow momentum.
- On-chain and technical analysts see support at $75,000, $74,000 and $71,000 and resistance at $80,000 and $84,000 as key inflection points, warning of a range-bound market and the possibility of a deeper correction.
Forecast Trend Report by Period


Bitcoin is under downside pressure as escalating geopolitical tensions in the Middle East combine with uncertainty over Federal Reserve policy. Traders are watching whether support at $75,000 holds and whether the cryptocurrency can break through resistance at $80,000.
As of 11:25 a.m. on May 1, Bitcoin was trading at $76,627 on Binance's USDT market, up 0.51% from a day earlier. On Upbit, it was quoted at about $79,200, equivalent to 114 million won. The kimchi premium, the price gap between domestic and offshore exchanges, stood at 0.97%.
Mideast Tensions and Fed Uncertainty Keep Markets in Wait-and-See Mode as Global Stocks Lose Steam, Crypto Slips
Rising geopolitical tensions in the Middle East and uncertainty over the policy outlook have left global financial markets searching for direction. New York stocks lost momentum, while digital assets weakened.

Axios and The Wall Street Journal reported on April 30 that President Donald Trump was maintaining pressure on Iran to abandon its nuclear program by keeping a maritime-blockade strategy in place around the Strait of Hormuz, while also considering limited military action if necessary. With negotiations deadlocked, the pressure campaign has heightened the risk that geopolitical tensions will persist.
Iran has also kept a hard-line stance, adding to the strain. Iranian politicians have pushed back against the blockade strategy and warned of a possible surge in global oil prices, fueling expectations that the standoff could drag on.
The Fed has added another layer of uncertainty by holding rates steady while maintaining a hawkish stance. On April 29, the Federal Open Market Committee left its benchmark rate unchanged at 3.50% to 3.75%, extending the pause for a third straight meeting. Four officials dissented, the widest internal split in more than 30 years, underscoring uncertainty over the policy path.
Powell told reporters that current rates are at an appropriate level while officials assess incoming data, reaffirming that the Fed is in no rush to either raise or cut borrowing costs. He acknowledged inflation pressure from higher energy prices but signaled a measured approach to any policy response. Powell also said he plans to remain on the Board of Governors for some time after his term as chair ends, emphasizing policy continuity and institutional independence.
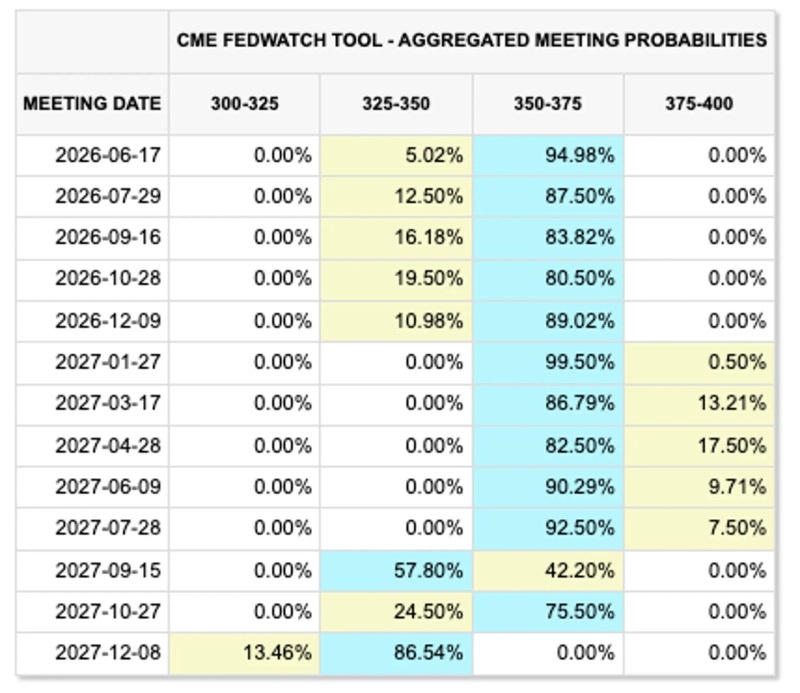
Markets remained in a wait-and-see mode as hawkish Fed policy and Iran-related geopolitical tensions combined to widen uncertainty. As of 11 a.m. on May 1, CME FedWatch showed a 95% probability of rates remaining unchanged in June and an 87% probability of another hold in July. The odds of no rate cut by year-end stood at 89%.
Money Rotates Into Bitcoin, but Slower ETF Flows Cloud Rebound Outlook
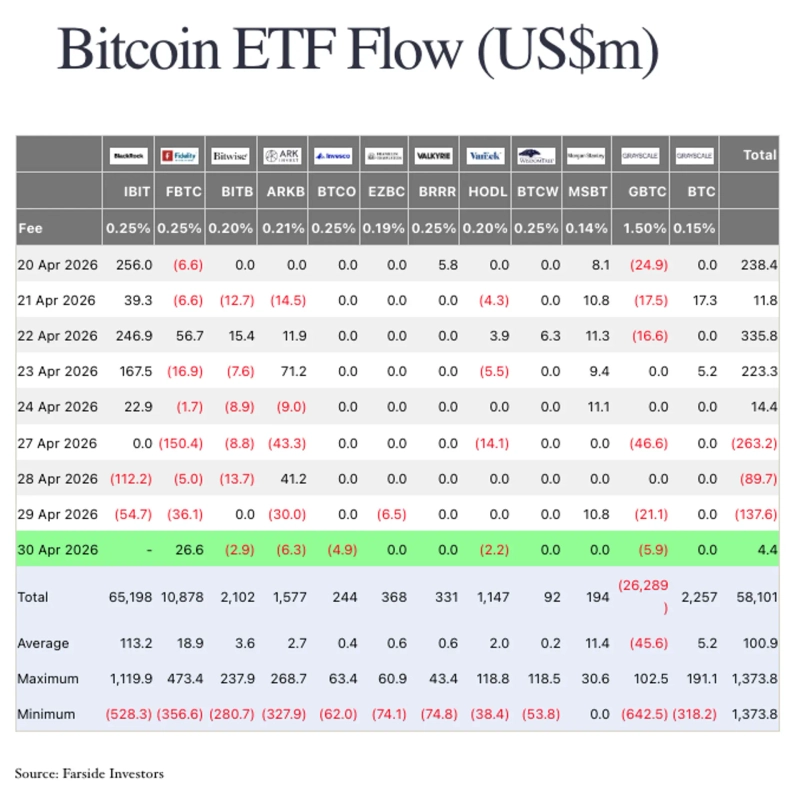
Inflows into U.S.-listed spot Bitcoin ETFs continued, but the pace has slowed, leaving support from fund flows less certain. Spot Bitcoin ETFs recorded net inflows of $823.7 million last week, but shifted to net outflows this week, weakening short-term momentum.
Even amid broader market weakness, capital has continued rotating into Bitcoin, reshaping flows across the crypto market. Bitfinex said Bitcoin dominance had continued climbing above 60%, adding that capital leaving DeFi and restaking markets was being redirected into Bitcoin rather than exiting the market altogether.
Part of that shift appears tied to instability in DeFi, including the KelpDAO incident, which recently resulted in losses of $292 million.
Against that backdrop, Bitcoin has remained stuck below key resistance levels without a clear directional break. Glassnode said in its weekly research report that Bitcoin has repeatedly faced resistance around the True Market Mean, about $78,000, and near $80,000. A recent surge in profit-taking by short-term holders has increased selling pressure and limited further gains.
Glassnode added that spot selling pressure was easing and some signs of renewed buying were emerging. Even so, the strength of that demand remains limited, suggesting the cryptocurrency may stay range-bound for now.
The True Market Mean is an on-chain pricing metric that reflects the average cost basis of market participants. It typically serves as a major support or resistance level.
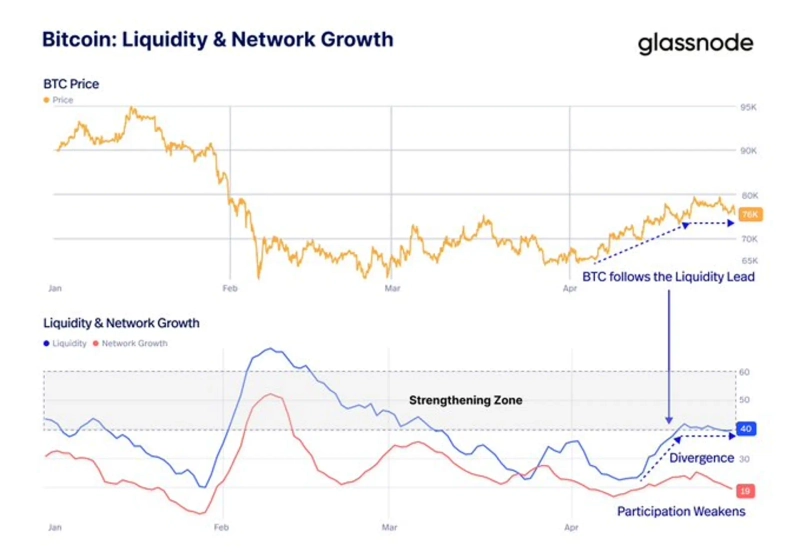
The recent rebound, which briefly touched $79,000, is also viewed as lacking durability. Bitcoin Vector said the move was driven in part by liquidity, while network growth had stalled, creating a gap between price action and fundamentals. It added that a modest increase in liquidity alone would not be enough to sustain the advance unless network participation also improved.
Bitcoin Trades Between $75,000 Support and $80,000 Resistance as Market Hunts for Direction
Analysts say Bitcoin has entered a near-term range between support at $75,000 and resistance at $80,000.
Bitcoin has moved into a support test during a short-term pullback. Ayush Jindal, an analyst at NewsBTC, said the token had turned weaker after falling below $76,500. Support near $75,000 is now the key level to watch.
On the upside, the $76,400 and $77,200 zones could act as major resistance, he said. A break above those levels could open the way toward the $78,000 area. If $75,000 gives way, however, further losses toward $74,200 and then $73,500 cannot be ruled out.
Another view is that Bitcoin has shifted into a seller-dominated phase, raising the risk of a deeper pullback. Alex Kuptsikevich, chief analyst at FxPro, said Bitcoin was retracing its recent rebound and moving into a gradual downtrend pattern. If the correction proves technical in nature, the $74,000 area could act as a key support zone.
A break of lower support levels could intensify the correction, according to Rakesh Upadhyay, an analyst at Cointelegraph. He said a drop below the 20-day moving average, around $75,800, would weaken the uptrend and could open the door to a correction toward the $71,000 area. A move above $80,000, by contrast, could create room for further gains toward $84,000.
Kang Min-seung, Bloomingbit reporter minriver@bloomingbit.io

Minseung Kang
minriver@bloomingbit.ioBlockchain journalist | Writer of Trade Now & Altcoin Now, must-read content for investors.