[Analysis] Bitcoin Breaks Above 365-Day Moving Average, Confirming New Bull Market
Summary
- Bitcoin's move above the 365-day moving average is a technical signal confirming entry into a new bull market, according to the analysis.
- The report said Bitcoin's break above the key $76,000-$81,000 supply zone has cleared the strongest short-term supply resistance.
- It identified an upper resistance zone at $88,000-$90,000 and downside support levels at $80,400 and $70,600, while adding that price pullbacks remain possible in the early stages of a bull market.
Forecast Trend Report by Period


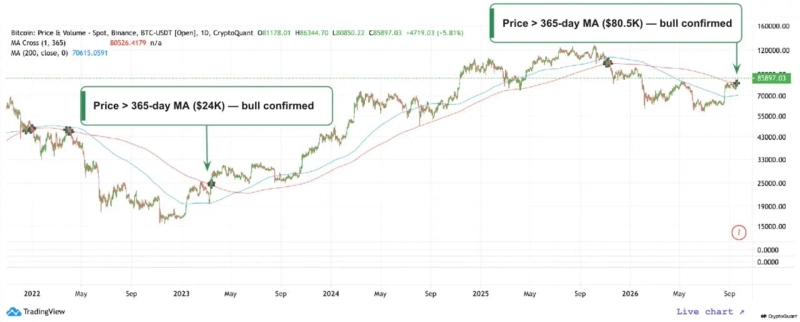
Bitcoin has entered a new bull market after reclaiming its 365-day moving average, CryptoQuant said.
In its weekly cryptocurrency report on Sept. 22, the on-chain analytics firm said Bitcoin had broken above the 365-day moving average, formed around $80,500, and was trading near $86,000. It described the breakout as a technical signal confirming the start of a new bull market.
CryptoQuant said the 365-day moving average has historically served as a key marker for major trend reversals in Bitcoin. In 2019 and 2023, bull markets followed after Bitcoin moved above the indicator. In late 2021 and November 2025, moves below it signaled the start of bear markets.
The firm said on-chain indicators also support the case for a bullish turn. CryptoQuant's Bull Score Index and Bull-Bear Market Cycle Indicator have been signaling an early bull market since mid-August. The move above the 365-day moving average, it said, provides technical confirmation of those earlier on-chain signals.
A break above a major supply zone is also strengthening the bullish outlook. Bitcoin has risen past the $76,000 to $81,000 range, where long-term holders and early investors who had held the token for more than seven years sold heavily this year. CryptoQuant said that suggests the strongest short-term supply resistance has been cleared.
The firm identified $88,000 to $90,000 as the next resistance zone. The $90,000 level in particular overlaps with the upper band of traders' on-chain realized price.
On the downside, CryptoQuant cited the 365-day moving average at about $80,400 and the 200-day moving average at $70,600 as key support levels.
CryptoQuant added that valuation, momentum and technical indicators all point higher, though price pullbacks can emerge in the early stages of a bull market.

Suehyeon Lee
shlee@bloomingbit.ioI'm reporter Suehyeon Lee, your Web3 Moderator.