

Summary
- According to CoinDesk, a rising wedge pattern was observed on the XRP chart, raising the possibility of a short-term decline.
- The analysis stated that if XRP's price falls below the support line, it could drop to as low as $1.60.
- It was further noted that XRP needs to recover to $2.18 to avoid a downtrend.
Negative analysis emerges for XRP, which has been on an upward trend over the past week.
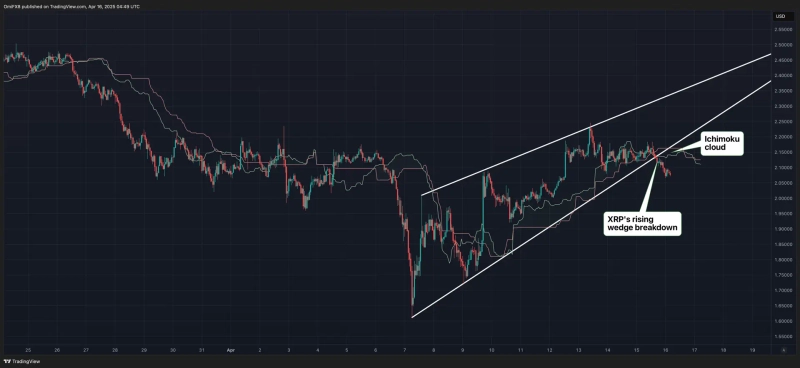
On the 16th (local time), the cryptocurrency-specialized media CoinDesk reported that a 'rising wedge pattern' was observed on the XRP chart, indicating a bleak short-term outlook for XRP.
A rising wedge pattern refers to a pattern where the lower trendline and the upper trendline meet. When this pattern occurs, if the price falls below the support line, it can switch from an uptrend to a downtrend.
CoinDesk explained, "The starting point of XRP's rising wedge structure can be identified as the support line," adding, "This means XRP could fall to $1.60." It further noted, "XRP also suggested the collapse of the rising wedge by falling below the Ichimoku Cloud on the hourly chart."
The price XRP needs to recover to invalidate the rising wedge pattern is estimated at $2.18.
Meanwhile, as of 2:43 PM today, XRP is recording $3.93 according to CoinMarketCap.

Uk Jin
wook9629@bloomingbit.ioH3LLO, World! I am Uk Jin.