Bitcoin bottom in October 2026? … '364-day correction' repeated in past cycles
Summary
- Bitcoin's past cycles were analyzed, and it was reported that a pattern of forming a bottom after about a 364-day correction period following the peak has repeated.
- Ali Martinez said that if Bitcoin undergoes about a 70% correction in this cycle, the potential trough could be around $37,500.
- It was reported that investors are paying attention to whether Bitcoin will show a flow similar to past cycles and to the possibility of a continued correction phase in the medium to long term.
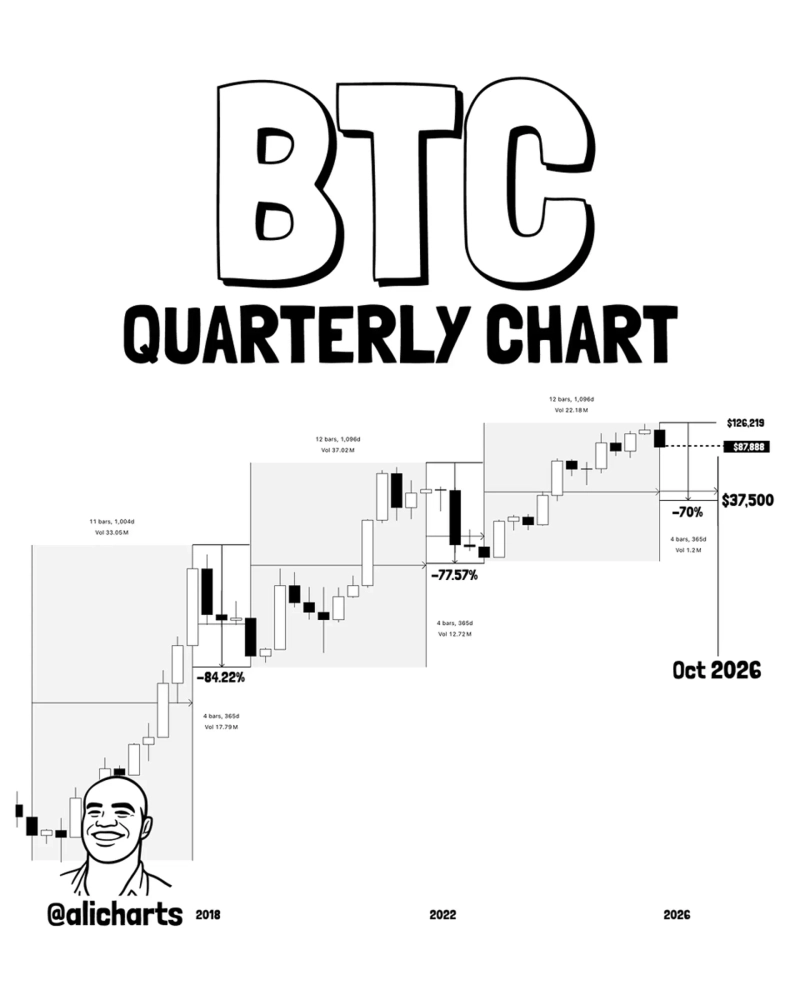
An analysis based on past price patterns has been presented regarding when Bitcoin will form a bottom in this cycle. Considering that in past major cycles a bottom was formed after about a 364-day correction period following the peak, it is observed that the bottom of the current cycle could be around October 2026.
According to a NewsBTC report on the 25th (local time), crypto asset analyst Ali Martinez wrote on X that Bitcoin's major cycles have shown a surprisingly similar rhythm in timing and decline. He compared the most recent three cycles based on quarterly price movements.
According to Martinez, Bitcoin has repeated a pattern in which it takes about 1,064 days from a previous bear-market low to the next bull-market peak. Applying this to the current cycle, under the assumption that the peak was the $126,000 range recorded in October this year, the time structure holds.
The time from peak to trough was also similar, about 364 days, in the 2017 and 2021 cycles. Martinez said, "If this pattern holds, Bitcoin is currently in a 364-day correction period and could form a bottom around October 2026."
A comparison with past cycles was also presented in terms of the decline magnitude. The 2018 bear market fell 84.22% from the peak and in 2022 it fell 77.57%. Based on this, Martinez estimated that if a roughly 70% correction occurs in this cycle, the potential trough could be around $37,500.
The short-term trend is assessed as lacking clear direction. Martinez analyzed that on the 4-hour chart Bitcoin is moving within a Parallel Channel. It recently bounced after retesting the lower support line, but it is currently positioned in the middle of the channel and does not show a clear advantage for either an upward or downward move.
Bitcoin is currently trading around $87,300 and is up about 0.7% over the past seven days. The market is paying attention to whether a flow similar to past cycles will repeat and to the possibility that a medium- to long-term correction phase may continue.

YM Lee
20min@bloomingbit.ioCrypto Chatterbox_ tlg@Bloomingbit_YMLEE