

Buffett-warned 'playing with fire' U.S. stock market, still not a bubble? [Bin Nansae's Infallible Wall Street]
Summary
- Recently, outflows have occurred from AI tech stocks, cryptocurrencies, and highly leveraged products, but Bloomberg analyzes that this is a 'position adjustment' — investors realizing gains and preparing for volatility.
- The reduction of excessive leveraged positions is being viewed as a positive factor for a healthier U.S. market rally going forward.
- It has been suggested that a bull market could resume toward year-end with rotations into energy, value stocks, and non-U.S. equities, and that declines should be used as buying opportunities.
Diagnosis of U.S. stock market bubble debate
The U.S. stock market, which has risen more than 30% since the low in April, is once again facing a bubble debate. Even in September, which is seasonally weak, the S&P 500 rose another 3% over the month, pushing almost all valuation indicators used to judge whether the market is overvalued to historical highs, and investors' doubts have resurfaced recently about whether the astronomical spending on artificial intelligence (AI) infrastructure that has driven the rally will actually translate into profits.
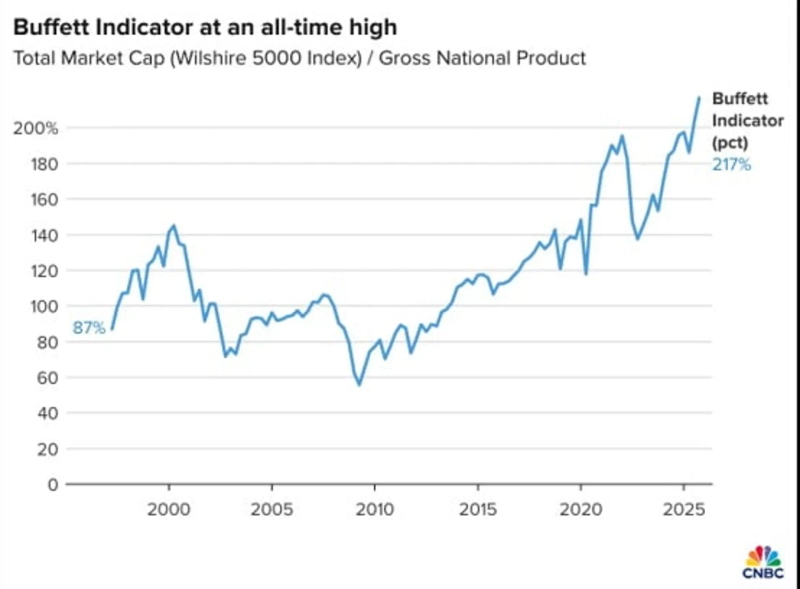
The so-called 'Buffett Indicator,' which became famous after Warren Buffett of Berkshire Hathaway called it "the best single measure of valuation," has already risen to an all-time high. This indicator, calculated by dividing the market capitalization of U.S.-listed stocks by GNP (gross national product), is currently 217%. It exceeds both the dot-com bubble (140%) and the post-COVID liquidity rally (190%).
Buffett previously warned that when this metric "approaches 200% it's like playing with fire," and it has now far exceeded that level. In fact, Federal Reserve Chair Jerome Powell's remark on the 23rd that "by many measures, the market is significantly overvalued" affected the market partly because investor sentiment had already become sensitive to such overvaluation concerns.
Reasons for renewed bubble concerns
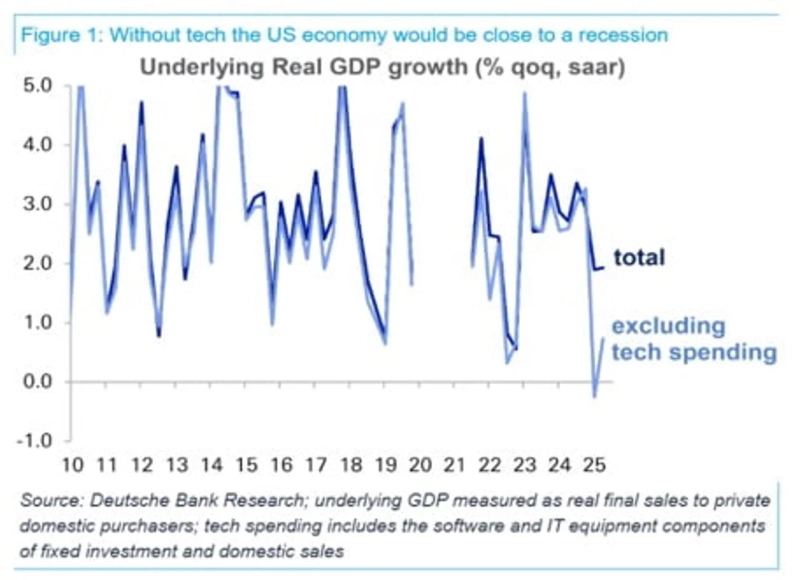
Some on Wall Street worry that the degree to which the U.S. stock market's rise relies on AI, detached from the real economy, is intensifying. The seemingly strong U.S. economic growth has in fact slowed markedly in domestic demand when excluding AI investment led by data centers. The six-month change in U.S. nonfarm payrolls is flat, and consumption that appears strong is hard to view optimistically if you exclude high-income households that account for half of it. Delinquencies on various loans—student loans, credit cards, auto loans—are also on the rise.
Nevertheless, since the emergence of ChatGPT in November 2022, AI-related stocks have accounted for 75% of the S&P 500's gains, 80% of earnings growth, and 90% of CAPEX increases, sustaining the high growth. If the real economy engine is truly cooling, then if the astronomical AI investments that have supported the market to date slow down or fail to translate into profits, the entire stock market could be shaken.
Two recent events have stoked such fears. First, the controversy over 'circular trading' involving NVIDIA-centered companies such as OpenAI, Oracle, Microsoft, and CoreWeave. Concerns have arisen that vendor financing reminiscent of the credit arrangements that were rampant during the dot-com bubble is being reproduced: NVIDIA invests equity in OpenAI, and OpenAI uses that money to buy NVIDIA chips.
Also, OpenAI agreed to receive cloud computing facilities from Oracle for $60 billion a year (about 85 trillion won), but OpenAI does not yet have this money. Oracle also does not yet have these facilities. Yet Oracle's stock has surged on expectations about this unrealized deal. If this expenditure is not executed, or if executed does not return profits — questions that might have been overlooked when everyone was optimistic can become a boomerang that constrains investor sentiment when overvaluation concerns grow.
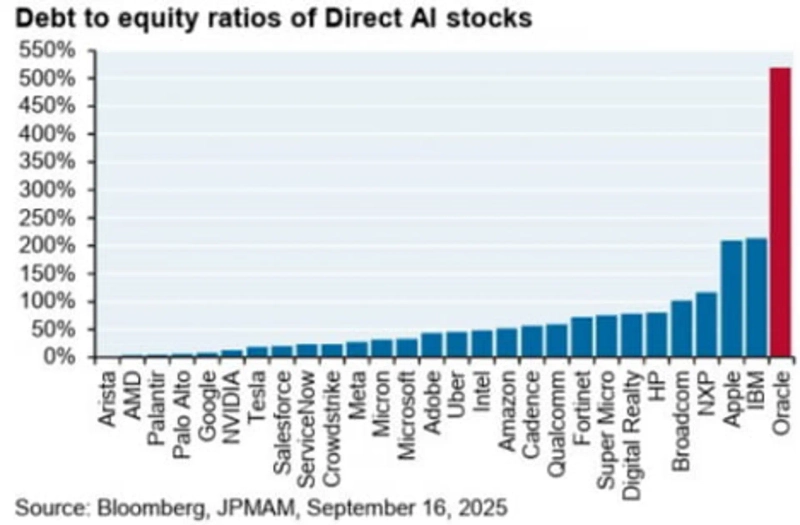
Moreover, Oracle recently issued $18 billion in bonds to raise this massive investment capital. Oracle's debt-to-equity ratio already exceeds 500%, far higher than Amazon (50%) and Microsoft (30%). Other hyperscalers may also have to competitively turn to debt financing rather than their own cash flows to cover massive investments. This is another factor that stokes fears that a pattern decisively different from the past dot-com bubble could be breaking. Sem Valest of J.P. Morgan Asset Management called Oracle's bond issuance "a signal of a shift from restrained competition to a debt-driven arms race."
"The metrics for valuation are changing"
It's not just stocks. The U.S. corporate bond market's yield spread over Treasuries has narrowed to historically low levels, heightening concerns about overheating. Nevertheless, these worries are not reflected in the prices of U.S. equities or corporate bonds. Is the market ignoring bubble signals? Or is there still no valuation problem?
Wall Street's consensus is the latter. On the 24th, Bank of America analyzed the U.S. market overvaluation controversy in depth in a report titled "S&P 500 is trading like a new risk-free asset."
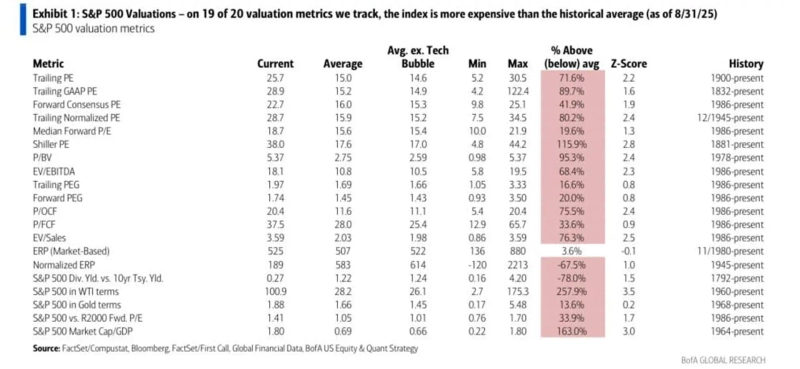
Looking only at valuation, the U.S. market certainly appears expensive. Of 20 valuation indicators for the S&P 500—P/E (price-earnings ratio), P/B (price-to-book ratio), P/S (price-to-sales ratio), V/EBITDA, etc.—19, excluding the short-term ERP (equity risk premium), are overvalued relative to historical averages (as of August 31). The ERP, based on long-term average earnings, is nearly 70% lower than its historical average, indicating equity overvaluation.
But Bank of America argues that this alone does not prove the market is a bubble. It says we should consider the possibility that a new valuation regime is taking hold as the industries and companies that comprise the index are changing.
△Unlike the 1980s when manufacturing accounted for 70% of the S&P 500, now companies with low dependence on assets and labor—technology, intellectual property, and innovation services—make up more than half. These industries have lower fixed-cost burdens and stable margins, which can justify higher multiples. Also, thanks to innovations from PC → internet → mobile → cloud → AI, revenue per company and per employee has steadily increased. This is another factor that can sustain higher valuations.
△Corporate debt structures have also improved qualitatively compared with the past. The share of long-term fixed-rate debt, which was only 44% in 2007, has risen to over 80%, making companies less sensitive to interest rate shocks, and the net debt-to-market-cap ratio of the S&P 500 has fallen to around 10%, giving it an almost debt-free character. This is the opposite trend of the U.S. government's rising debt share.
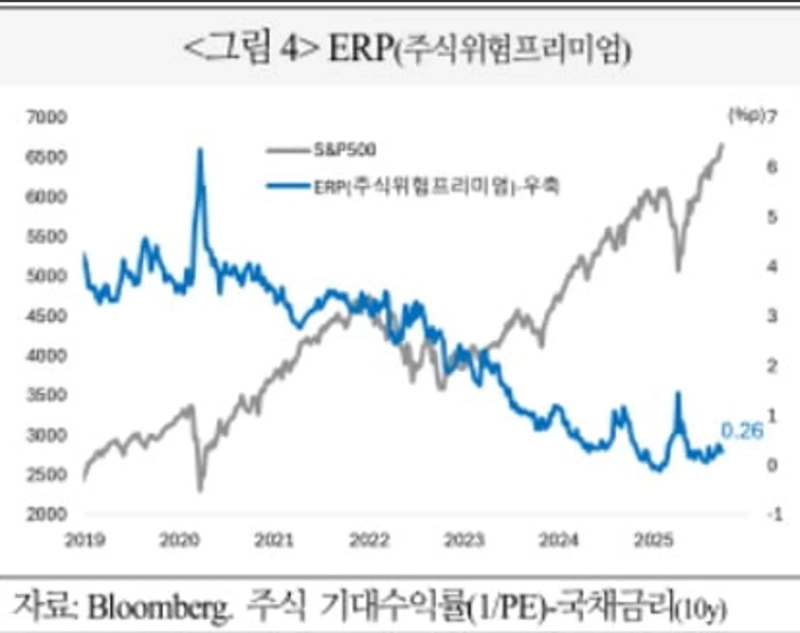
The ERP (expected equity return minus Treasury yield), which looks very low now, may simply be normalizing. During the era of ultra-low rates and quantitative easing, Treasury yields were abnormally low, which inflated the ERP. There was an illusion of undervaluation where stocks appeared much more attractive than bonds.
But now that rates are normalizing, the ERP is converging downward into a normal range. Thus, the lower ERP should be seen not so much as evidence that stocks are excessively overvalued relative to bonds, but rather as the reversal of the previous illusion caused by abnormally low past rates that made stocks look undervalued.
Bank of America believes that these structural changes increase the likelihood that the S&P 500's high multiples could persist over the medium to long term. Repeated overvaluation debates can be resolved through earnings growth rather than stock price declines. Global fiscal easing and Fed rate cuts are favorable factors for an expansion in the corporate earnings cycle. If the economy supports it, inflation is not necessarily only a risk. Price increases from inflation can lead to revenue growth, and if operating leverage increases the profit share of revenue, it can contribute to earnings and valuations.
However, not all stocks and sectors are equally favorable. Bank of America rates energy, healthcare, and REITs as the most undervalued sectors on a relative-value basis. By contrast, IT and consumer discretionary are seen as overvalued despite structural premiums. Its top-preferred sector that combines value, price momentum, and earnings upside potential is communication services.
Actions to guard against volatility amid the bull market
This outlook for a structurally strong U.S. market is broadly shared on Wall Street. On the 29th (local time) Goldman Sachs upgraded its investment stance on global equities including the U.S. from neutral to overweight, and J.P. Morgan's trading desk expects the S&P 500 to rally toward 7,000 by year-end in the fourth quarter.
However, it is worth noting that subtle shifts in investor sentiment are continuing ahead of quarter-end even as bullish forecasts persist. Funds have recently flowed out, particularly from AI tech stocks, cryptocurrencies, and highly leveraged products. Last week, a cascade of leveraged position liquidations in the cryptocurrency market erased $300 billion in market capitalization. Leveraged ETFs such as the 3x semiconductor ETF (SOXL) and Tesla leveraged ETF (TSLL) saw $7 billion in outflows in total — the largest since 2019. Instead, funds have flowed into cash-equivalent ETFs, gold funds, and volatility products.
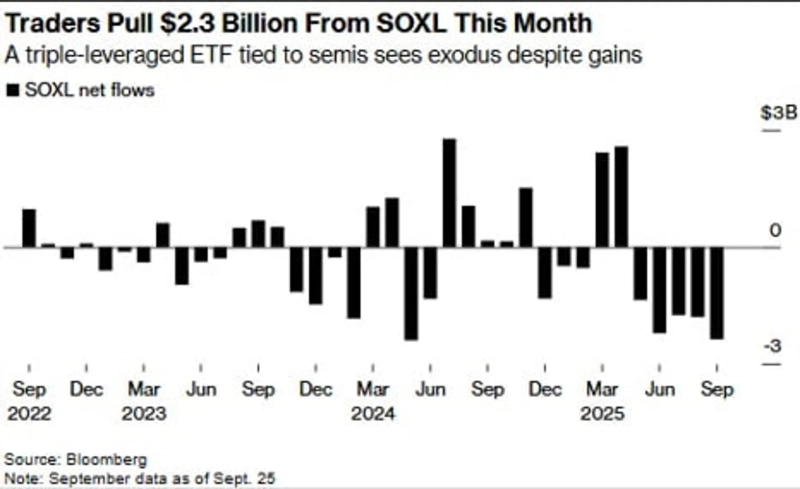
Bloomberg's analysis is that the weakening momentum of the market is closer to 'position adjustment' than a fear signal of a sharp crash. Investors are realizing gains after strong rallies and preparing for potential volatility.
In fact, excessive deleveraging can be viewed positively for a healthier rally going forward. The Q3 earnings season is about to begin. Whatever changes occur in macroeconomic data and the resulting Fed rate outlook, if corporate earnings come in well, the market can find upward momentum despite overvaluation concerns.
Citadel Securities' head of equities and derivatives strategy Scott Lubner also maintains the position that "there are tactical risk concerns through the first half of October, but this is a structural bull market." He argues that with accelerating retail investor buying, resumption of share buybacks, and AI themes, a year-end rally could resume and that declines should be seen as buying opportunities. He specifically advises watching for rotation into energy, value stocks, and non-U.S. equities.
New York = Bin Nansae, correspondent binthere@hankyung.com

Korea Economic Daily
hankyung@bloomingbit.ioThe Korea Economic Daily Global is a digital media where latest news on Korean companies, industries, and financial markets.