PiCK
Bitcoin on alert for Middle East-driven 'oil price variable'…Ethereum holds $2,000; XRP flashes rebound signal [Lee Soo-hyun’s Coin Radar]
Summary
- Bitcoin said the key will be whether it can establish a foothold at $70,000 amid Middle East-driven oil price gains and concerns about delayed rate cuts.
- Ethereum reported that it is holding the $2,000 level as derivatives long/short liquidations cool and the scarcity index rises on declining exchange balances.
- XRP (XRP) reported that the $1.4 and $1.55 levels are key inflection points amid increasing spot ETF inflows and a surge in exchange withdrawals.
Forecast Trend Report by Period


<Lee Soo-hyun’s Coin Radar> is a column that reviews weekly trends in the virtual asset (cryptocurrency) market and explains the background. Going beyond a simple list of price moves, it provides a multidimensional analysis of global macro issues and investor behavior, offering insights to gauge market direction.
Major coins
1. Bitcoin (BTC)
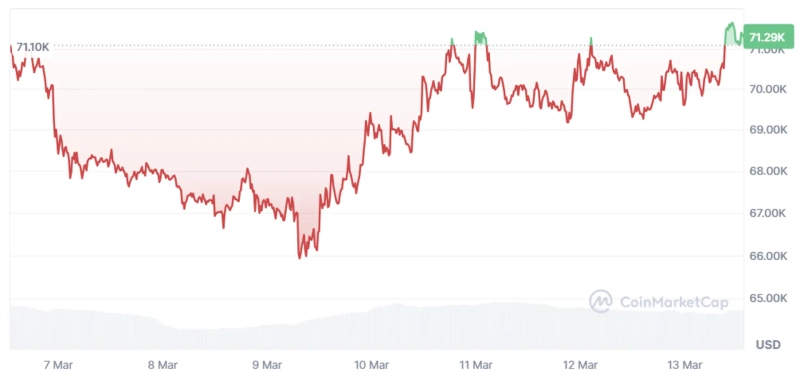
This week, Bitcoin repeatedly swung around the $70,000 level despite war risks emanating from the Middle East. As of the 13th, Bitcoin is still trading around $71,000 on CoinMarketCap.
The variable the market reacted to most sensitively was oil. According to Bloomberg on the 11th (local time), Brent crude for May delivery—an international benchmark—briefly hit $100.25 a barrel, reclaiming the $100 level. The previous session’s close also surged 4.8% to $91.98. In the process, Bitcoin likewise slipped at one point to around $69,000.
The problem was that the market did not feel reassured even after the International Energy Agency (IEA) decided to release a record 400 million barrels of emergency stockpiles. According to Macquarie analysis, that volume amounted to only about four days’ worth of global daily output, or about 16 days’ worth of crude flows through the Gulf routes. That is why, despite the headline figure looking large, the perceived real-world impact was assessed as limited.
The U.S. also moved to respond immediately. On the 11th, the Trump administration said it would release about 172 million barrels from the Strategic Petroleum Reserve and supply it to the market over roughly 120 days starting next week. Even so, oil prices were not easily contained. That same day, Mojtaba Khamenei—elected Iran’s new supreme leader—mentioned retaliation against the U.S. and Israel and even expressed willingness to block the Strait of Hormuz. Oil, which had entered a brief pause, then surged again.
Rising oil prices are also unsettling rate expectations, weighing on Bitcoin. According to Reuters on the 12th, Goldman Sachs pushed back its forecast for the Fed’s first rate cut from June to September. The revision reflected concerns over an Iran-driven oil supply shock and the resulting inflation pressure.
Goldman Sachs raised its fourth-quarter Brent forecast to $71 from $66, and its West Texas Intermediate (WTI) forecast to $67 from $62. However, it added that “if labor-market cooling accelerates faster than expected or GDP growth weakens further, the timing of rate cuts could be brought forward again.”
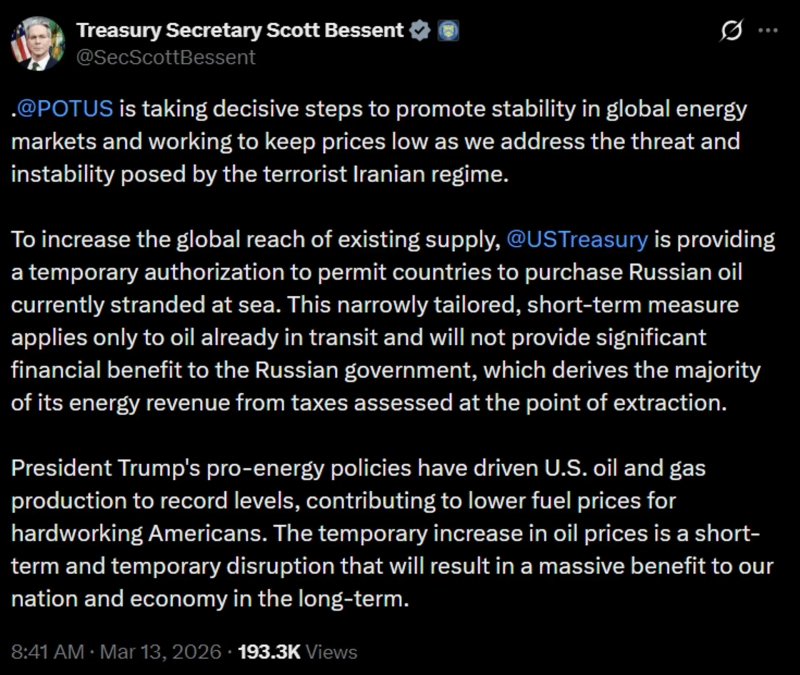
The market reacted again as the U.S. Treasury rolled out additional measures. On the 12th, Treasury Secretary Scott Bessent wrote on X that he would “allow countries to temporarily purchase Russian crude that is effectively stuck at sea to lower energy prices and promote market stability.” The move aims to ease supply pressure by expanding the global distribution reach of existing supply. After the announcement, Bitcoin briefly touched the $72,000 level.
Looking ahead, the price outlook ultimately hinges on whether Bitcoin can secure the $70,000 level in a stable manner. Nansen’s analysis team said, “Until Bitcoin clearly breaks above $71,000 and holds, this zone will act as strong resistance rather than a springboard for further gains.”
Ayush Jindal, an analyst at NewsBTC, also said that “if the resistance zone between $70,000 and $70,500 is broken, room could open for a rise toward $71,200 and $72,000.” Conversely, if the $68,400 support breaks, pullback risk could open toward $68,000, $67,250, and even $66,500.
2. Ethereum (ETH)
Ethereum held the $2,000 level relatively well this week. As of the 13th, Ethereum is moving around $2,100 on CoinMarketCap.
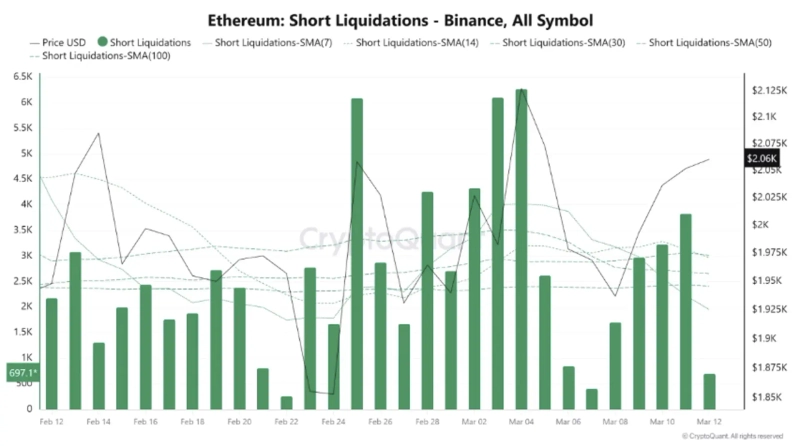
A key reason cited for Ethereum’s resilience amid broader market jitters is the easing of overheating in the derivatives market. According to CryptoQuant data, short liquidations surged around February 25 and March 3–4, driving Ethereum sharply higher. More recently, however, the number of short liquidations has fallen to around 700. This suggests that a significant portion of large short positions has been unwound, reducing liquidation-driven buying pressure. The same applies to longs. There were large-scale liquidations of about 7,000 in mid-February, with several spikes again in early March, but recently they have declined to around 1,000. This indicates that intense selling pressure from long liquidations has also largely subsided.
In short, Ethereum is now in a phase where most long and short liquidations have been cleared and excessive volatility has diminished. Rather than spiking or plunging on forced liquidations, it has been maintaining the $2,000 level within a relatively stable trend. In fact, over the past few days, prices have been rising while both short and long liquidations have decreased at the same time. This is taken as a signal that prices are being driven more by spot demand than by forced liquidations.
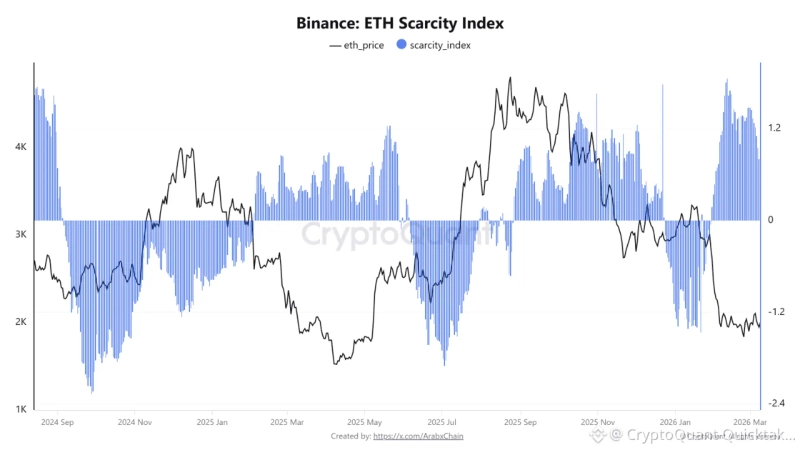
Supply-side indicators are also being interpreted positively. Binance’s so-called “scarcity index,” a key internal supply indicator, has risen to 0.67. This metric shows how much the amount of Ethereum sitting on exchanges has declined versus the historical average. A positive value means fewer coins are immediately available for sale on exchanges than in the past. In effect, with less sell supply coming to market, conditions are being created that support prices. Historically, recoveries have often followed when the scarcity indicator turns from negative to positive.
In terms of price outlook, $2,108 and $2,150 are cited as key resistance levels. Investment outlet FXStreet said, “Immediate resistance is $2,108,” adding that “if a daily close is secured above it, the next targets could be $2,389, and further upside could extend to $2,746.” On the downside, it viewed $1,741 as the first support, with further downside room to $1,524 and $1,405 if that level breaks.
Crypto-focused outlet CryptoNews said, “A break above $2,150 is an important inflection point,” adding that “if this zone is cleared, the next resistance band could form between $2,200 and $2,400.” However, it cautioned that if the daily close falls below $1,900, the possibility of testing the $1,800 support still remains.
3. XRP (XRP)
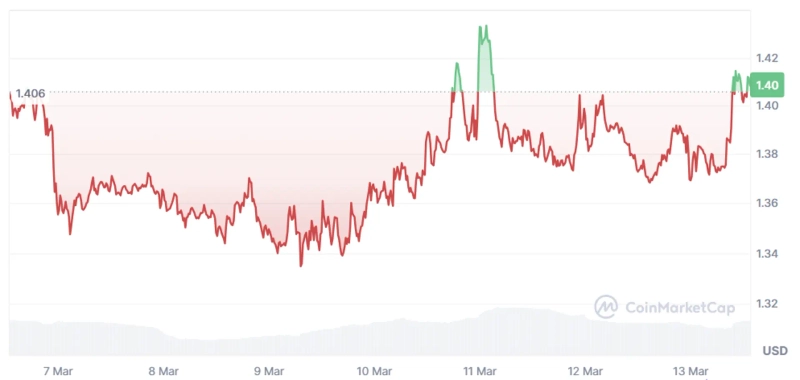
XRP traded this week in the $1.3–$1.4 range, showing a relatively limited rebound. As of the 13th, it is still moving around $1.4 on CoinMarketCap.
However, the market is focusing on signs that a rebound signal is being detected in XRP. TOTAL3, which refers to the total crypto market capitalization excluding Bitcoin and Ethereum, has recently moved between $640 billion and $740 billion, rising about 11% since early February. As of the 12th, it climbed about 3% in a single day, confirming some inflows as well.
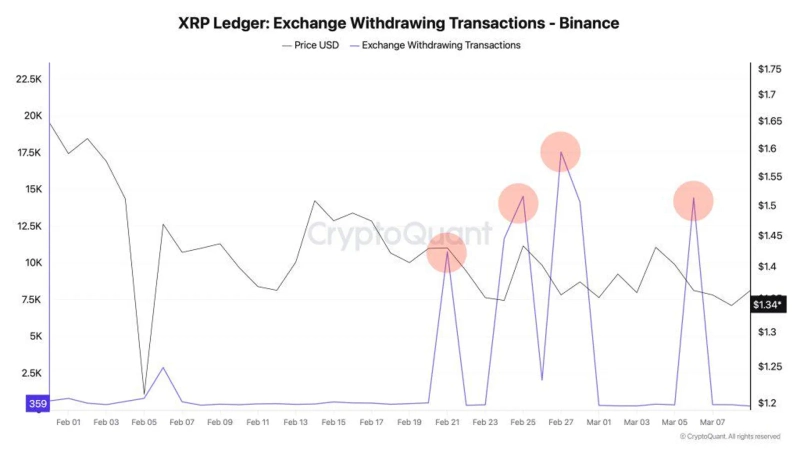
Against this backdrop, the reason XRP is drawing particular attention is that positive signals are emerging simultaneously from on-chain data and spot ETFs. According to CryptoQuant, XRP withdrawal transactions on Binance spiked several times over the past few days, and on March 6 in particular, more than 14,000 transactions occurred. In general, rising exchange withdrawals are often interpreted as long-term holding or transfers off-exchange—that is, accumulation.
Demand for U.S. XRP spot exchange-traded funds (ETFs) also remains solid. Bloomberg analyst James Seyffart said that “XRP spot ETFs have held up quite well even though the price has fallen sharply recently.”
In fact, the U.S. XRP ETF has recorded cumulative inflows of about $1.4 billion since its launch last November through the present. In addition, inflows, which were around $150 million in mid-November 2025, increased to $1.44 billion by early March this year. This suggests that institutional investing is continuing despite deteriorating market conditions, and can also be read as a signal that funds are flowing selectively into XRP rather than into the altcoin complex broadly.
For price outlook, the area around $1.4 is being presented as a key zone. Crypto outlet NewsBTC cited $1.370 and $1.3680 as key downside supports. If that zone breaks, it said a declining channel could open toward $1.3217. Conversely, for buying interest to recover, it argued that $1.3840 and $1.3920 must be reclaimed in sequence, with a final requirement of establishing a foothold at $1.40. After that, it said a rally targeting $1.4250 and $1.450 could be expected.
TradingNews presented a weekly close of $1.55 as the decisive inflection point for XRP. It judged that only above that price would the post-January downtrend structure be broken, opening the door to further rebound potential toward the $1.85 zone.

Suehyeon Lee
shlee@bloomingbit.ioI'm reporter Suehyeon Lee, your Web3 Moderator.