Bitcoin Tests 100-Day Moving Average Again; Break Above Could Send It to $80,000
Summary
- Bitcoin is again testing the 100-day moving average (100-day MA), a level viewed as a key resistance line.
- After failing to break above the 100-day MA on two previous occasions, Bitcoin fell 30%% and 39%%, respectively. Another rejection could form a triple-top pattern and drag the token down to $59,800.
- If Bitcoin breaks above the 100-day MA and holds that level at the close, it could be interpreted as a signal of a bullish trend reversal, with room to rise to $80,000 to $84,000.
Forecast Trend Report by Period


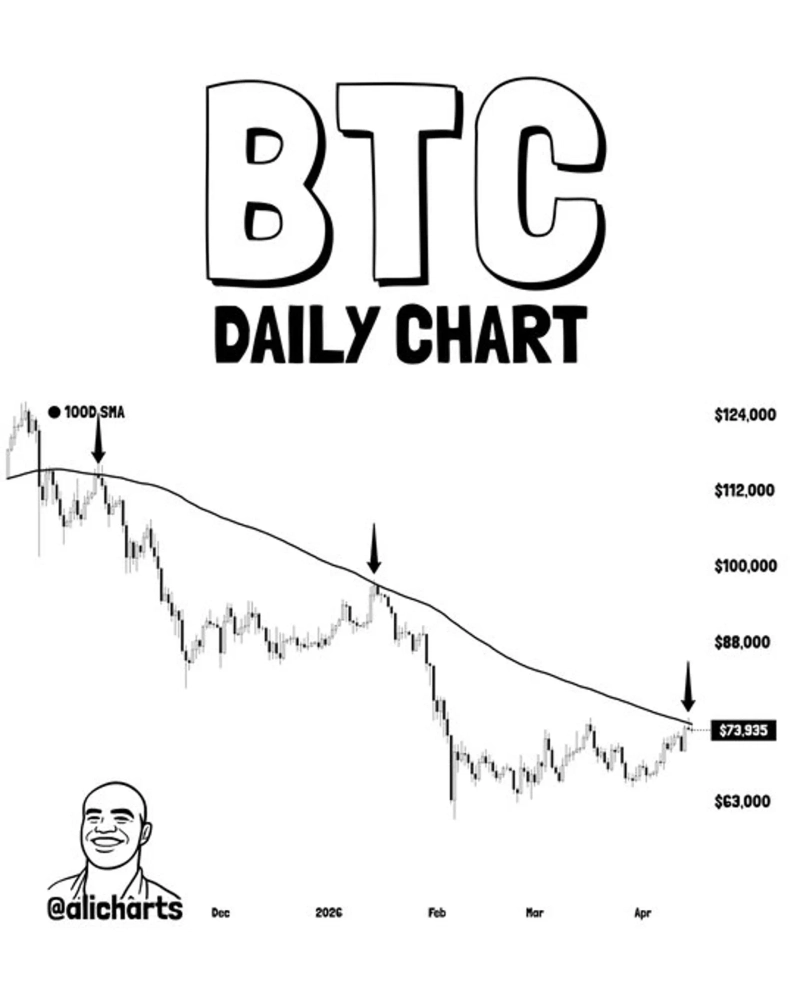
Bitcoin is testing its 100-day simple moving average again, revisiting what digital-asset analyst Ali Martinez described as a key resistance level.
Martinez wrote on X on April 16 that Bitcoin has tested the 100-day moving average as resistance three times over the past six months. It failed to break above the level in October last year and again in January, falling 30% and 39%, respectively, after those rejections.
Another failed breakout could form a triple-top pattern and lead to broader structural weakness, he wrote. In that case, Bitcoin could fall to $59,800.
A move above the resistance level would support the opposite case. If Bitcoin breaks above the 100-day moving average and holds it on a closing basis, that could signal a bullish trend reversal and push the price to $80,000 to $84,000, Martinez said.

Uk Jin
wook9629@bloomingbit.ioH3LLO, World! I am Uk Jin.