

S&P 500, Uncertainty Remains Ahead of Long Holiday... Upside Potential May Be Limited [Investing.com]
Summary
- The S&P 500 index reported that the short-term uptrend may be limited at the 5,510-point resistance level.
- It was noted that if there is progress in the U.S.-China trade situation, Wall Street's recovery could continue, so it should be closely watched.
- In the current market environment, it is important to focus on two-way trading opportunities through level-to-level trading rather than long-term directionality.
By Fawad Razaqzada
U.S. Futures Index Rebounds with Global Markets... But Caution Remains Ahead of Holidays
Optimism in Trade Talks with Japan, ECB's Decision Encourages Cautious Buying in Risk Assets
S&P 500 Shows Signs of Forming a Bottom, But Resistance Near 5,510 May Constrain Short-Term Uptrend
After yesterday's decline, U.S. index futures are rebounding along with European and Asian markets. However, with most Western markets approaching the Easter holiday this week, it remains uncertain whether this upward trend can be sustained.
Following last week's significant rebound, U.S. stocks have shown some sluggishness this week, with all three major indices down on a weekly basis. Meanwhile, European stocks remain in positive territory, suggesting that investors may be avoiding the U.S. market and considering European stocks as a 'safe haven' to some extent.
However, if there is further progress in the U.S.-China trade situation, Wall Street's recovery could resume. Today's market rebound is led by tech stocks, driven by President Trump's mention of "big progress" in talks with Japan and TSMC's announcement of maintaining its growth outlook for 2025. Netflix's (NASDAQ:NFLX) earnings, to be announced after the market close, are also drawing attention.
What is Driving Market Sentiment Today?
Geopolitical negotiations and central bank stances are driving markets globally. President Trump eased tariff conflict concerns by stating "big progress" in talks with Japan, leading to a 1.5% rise in the Nikkei 225.
Meanwhile, Wall Street is regaining stability after Wednesday's Powell-induced wobble. The Fed Chair has taken a 'cautious watch' stance on tariffs and inflation pressures, effectively ruling out quick intervention.
Attention now turns to the European Central Bank (ECB) rate decision. Speeches by ECB President Christine Lagarde and others are scheduled, and the ECB is expected to implement its seventh rate cut today.
S&P 500 Technical Analysis
Looking at the charts, Wall Street is currently in a sideways market, with both buying and selling pressures influencing market direction.
This means that instead of a one-way upward trend as before, a volatile market suitable for short-term trading is unfolding.
Nevertheless, there are some signals that the market may have already formed a bottom, focusing interest on future trends.
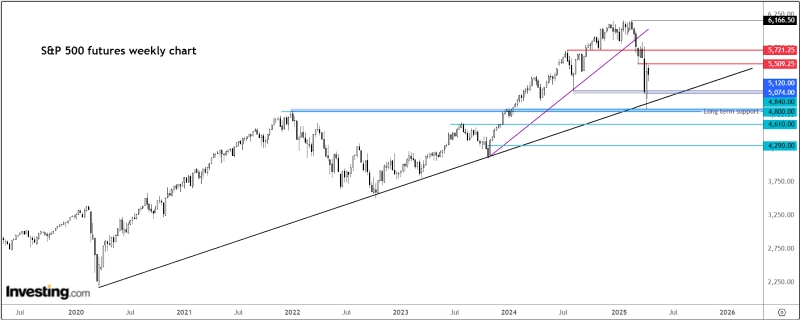
Notably, last week the S&P 500 index rebounded from early weakness to record a major weekly gain of about 5.9%, recovering a significant portion of the previous week's 9% plunge. This rebound occurred near an important support level, where the long-term uptrend line since the pandemic low and the past major resistance zone of 4800-4840 points overlap. This zone could act as the most important long-term support level in future correction phases, so it must be marked on the chart as a key area.
With the long-term support line mentioned above holding, another important support zone at the current time is the 5047-5120 point range. This gray box area was a support line that collapsed during the past tariff-related plunge, but recently it has shown a 'support recovery' trend by reclaiming this zone. If last week's large bullish candle was a true reversal signal, this line is likely to act as support again even if prices fall to this zone in the future. Of course, not everything goes according to theory, so all scenarios must be prepared for.
The most notable resistance line currently is around 5510 points. This is the last low before the large decline a few weeks ago, and a former support area that has now turned into resistance. For bulls, the market must break through this resistance line again for the upward trend to resume and regain control of the bullish momentum. Until then, even short-term upward movements should be interpreted cautiously.
In addition to the long-term zones mentioned above, there are key areas on the daily chart to watch for short-term trading decisions. Particularly, the 5251-5286 point range is the blue box area that provided support after yesterday's decline, and this zone must continue to provide support for the short-term upward trend to be maintained. If this zone breaks, the possibility of a decline to the long-term support zones mentioned in the weekly chart cannot be ruled out.
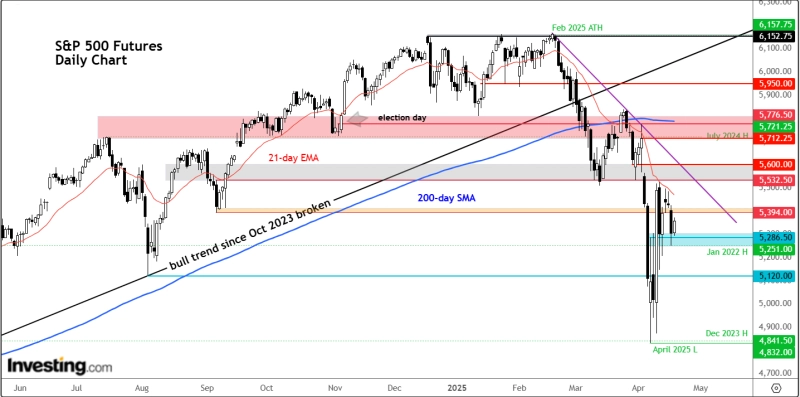
From a resistance perspective on the daily chart, the first level to watch is 5394 points. This level acted as support last September and briefly provided support after last week's rally but ultimately broke during Wednesday's sharp decline.
Above that, the 21-day exponential moving average (EMA) is located, and the more important resistance zone is between 5532-5600 points. This zone is considered a major resistance area that coincides with the short-term downtrend line formed after the February high and was a former support area.
How to Trade in the Current Macroeconomic Environment?
In the current macro environment, it is advisable to focus on 'level-to-level trading' rather than long-term directionality. Instead of trying to predict market direction, it is important to seek two-way trading opportunities by utilizing realistic volatility-based rebound zones.
Reducing fixed biases about direction and maintaining a neutral perspective is advantageous. This makes it much easier to flexibly reverse positions when the market turns.

Korea Economic Daily
hankyung@bloomingbit.ioThe Korea Economic Daily Global is a digital media where latest news on Korean companies, industries, and financial markets.